
A review of Berkshire Hathaway’s twelve years of ownership
“Our country’s future prosperity depends on its having an efficient and well-maintained rail system. Conversely, America must grow and prosper for railroads to do well. Berkshire’s $34 billion investment in BNSF is a huge bet on that company, CEO Matt Rose and his team, and the railroad industry. Most important of all, however, it’s an all-in wager on the economic future of the United States. I love these bets.”
— Warren Buffett, November 3, 2009
Introduction
Nearly a decade into the twenty-first century, the economic future of the United States seemed anything but assured. Faith in the financial system had been shaken by the events of 2008, but the malaise extended far beyond Wall Street. Americans were facing high unemployment and the deflation of the housing bubble took a major toll on household balance sheets. The stock market bottomed in early 2009, but bearish pundits never failed to make comparisons to the abortive bear market rallies of the early 1930s. Widespread despair threatened to bring about a self-fulfilling prophesy.
In the days after the 1929 stock market crash, John D. Rockefeller Sr. bought stocks, including a million shares of Standard Oil of New Jersey, and issued a press release intended to boost the confidence of investors:
“These are days when many are discouraged. In the ninety years of my life, depressions have come and gone. Prosperity has always returned, and will again. Believing that the fundamental conditions of the country are sound, my son and I have been purchasing sound common stocks for some days.”
During the dark days of 2008 and into 2009, Warren Buffett assumed a similar role as a confidence builder. Starting with his Buy American. I Am. article in October 2008, Mr. Buffett made clear his confidence in the long-term health of the economy as well as the benefits of owning stock in American companies.1
Warren Buffett is not omniscient, and his “Buy American” article appeared several months before stocks hit bottom. Mr. Buffett is known for buying stocks when he sees opportunities regardless of macroeconomic prognostications.
Burlington Northern Santa Fe is a case in point. Mr. Buffett began accumulating shares in August 2006, long before the financial crisis, and Berkshire owned 22.5% of the railroad by early 2009.2 Much to the surprise of many observers, on November 3, 2009, Berkshire Hathaway and BNSF announced a definitive agreement for Berkshire to acquire the company, a transaction that was completed on February 12, 2010.
In the exhibit below, I have estimated the cost of the acquisition. At the close of the deal, Berkshire’s existing 22.5% interest in BNSF had a carrying value of $6.6 billion.3 To acquire the rest of the company, Berkshire paid $15.9 billion in cash and issued Berkshire Class A and Class B shares with market value of $10.6 billion.

It is important to put the size of this acquisition in the proper context. Prior to the issuance of the new shares, Berkshire Hathaway had 1,551,749 Class A equivalent shares outstanding as of December 31, 2009 and a market capitalization of approximately $173 billion as of February 12, 2010. Buying BNSF was not quite a “bet the company” move but it was certainly a transformative acquisition that sent a strong message regarding the future of the United States economy.
At the time of the acquisition, many observers were under the impression that BNSF would retain most of its earnings and that Berkshire might direct additional cash to the railroad. Instead, BNSF has paid distributions to Berkshire over the years. Since the acquisition, BNSF has paid Berkshire a cumulative total of $47.7 billion, a figure that far exceeds the value of the cash and stock that Berkshire paid to acquire BNSF.4
In late 2009 and early 2010, I wrote several articles about BNSF, including on the day of the announcement as well as on the day the transaction was completed. In addition, I wrote about the merger proxy, Mr. Buffett’s discomfort with using Berkshire shares in the deal, the use of insurance float to fund part of the transaction, and BNSF’s performance and the potential for expansion.5
In 2013, I revisited the acquisition and I have followed the company ever since in Berkshire Hathaway’s quarterly and annual reports as well as the more detailed financial information that BNSF continues to release. The purpose of this article is to take a look at BNSF again over twelve years after the acquisition.
The article is divided into the following sections:
- Operating History. BNSF has posted relatively slow revenue growth since the acquisition, but profitability has improved significantly due to more efficient operations and the corporate income tax cut that took effect in 2018.
- Balance Sheet Review. BNSF’s asset base has grown since the acquisition with property and equipment accounting for the bulk of the increase. The enlarged asset base has been funded roughly equally with equity and long-term debt.
- Cash Flow Generation. Since the acquisition, BNSF has generated cumulative cash flows from operations of $82.7 billion. Capital expenditures, including equipment, consumed $45.5 billion, leaving $37.2 billion of free cash flow.
- Capital Allocation. Since the acquisition, BNSF has distributed $47.7 billion to Berkshire, accounting for all free cash flow plus the net proceeds of additional debt incurred since the acquisition. The narrative surrounding the acquisition when it was made does not quite match what has taken place in terms of internal reinvestment opportunities. BNSF has become a cash cow.
- Conclusion. Was Berkshire Hathaway’s acquisition of BNSF a success? Among other things, we need to consider the fact that Berkshire shares were issued to fund part of the acquisition. Did Berkshire gain more than it gave up in dilution? Will BNSF be able to continue strong advances in net income without the twin tailwinds of a declining operating ratio and a lower tax rate?
Operating History
BNSF is the product of 390 predecessor railroads dating back to 1849.6 The company provides critical infrastructure for the United States, covering 143 million miles and carrying 535 million tons of cargo in 2021.7 Over a network of 32,500 miles in twenty-eight states and three Canadian provinces, the company operates an average of 1,200 trains per day. BNSF’s orange locomotives are ubiquitous sights in the western two-thirds of the country as they travel over 25,000 grade crossings, 13,000 bridges, and 89 tunnels. The railroad serves over forty ports and has twenty-six intermodal facilities. By any of these measures, the railroad is a massive operation.8
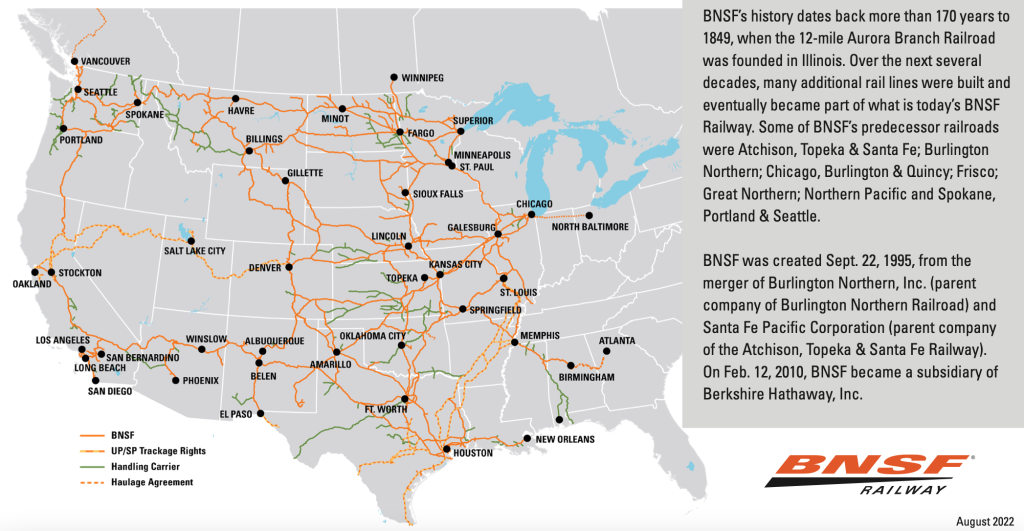
In most of the western two-thirds of the United States, BNSF and Union Pacific represent a duopoly with networks and systems that would be impossible to create from scratch today. Although railroads face competition from long-distance trucking, railroads have the advantage of being far more efficient in terms of how much cargo can be carried per gallon of fuel.9 One downside of concentration in the industry is that railroads are subject to political scrutiny and expected to provide reliable and cost-effective services for customers who have limited alternatives.
The freight railroad business model is relatively straight forward. The capital investments required to build and maintain the network makes it possible to carry freight for customers which represents the primary source of revenue. In the exhibit below, we can review BNSF’s freight revenue segmented by product type:

The rate that a railroad can charge to carry a carload of freight varies by the type of product that is being shipped. The exhibit below shows the number of carloads of freight that were carried during each period and the average revenue per carload:
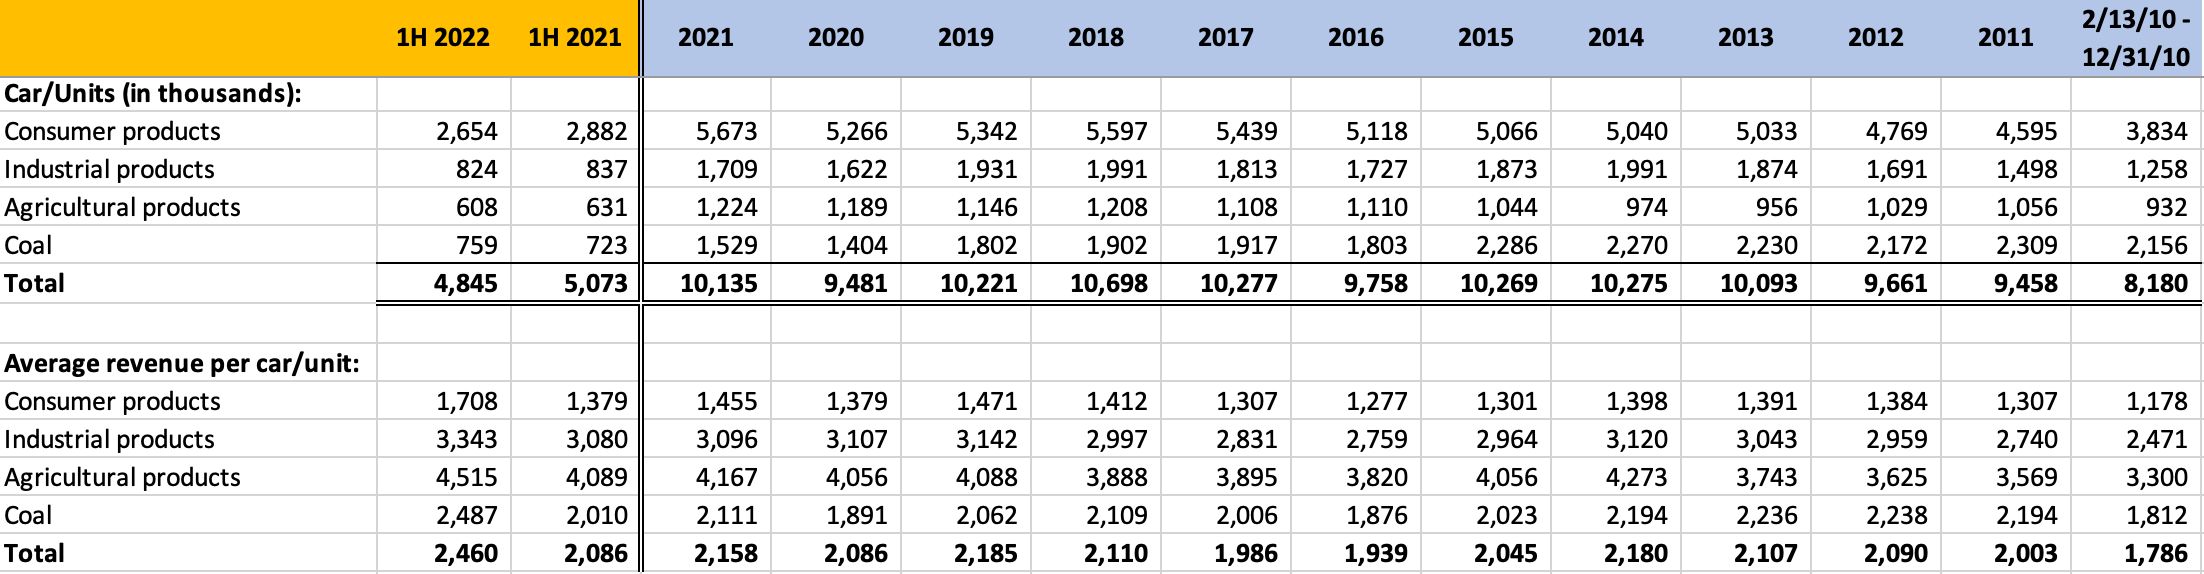
We can see that BNSF shipped a total of 10.1 million carloads in 2021 and the average revenue earned from each carload was $2,158. However, the composition of carloads by product type varies from year to year and the average revenue per carload varies based on the type of product. For example, the average revenue per carload of consumer products is lower than the average revenue per carload of other products.
By examining carloads shipped along with revenue per carload, we can better understand BNSF’s revenue in terms of physical volume and pricing power.
For example, physical volume and average revenue per carload dropped in 2020 as the pandemic impacted the economy. This resulted in a freight revenue decline of 11.4% in 2020. In 2021, physical volume and average revenue per carload increased resulting in a freight revenue increase of 10.6%. In the first half of 2022, physical volume declined but was more than offset by an increase in average revenue per carload resulting in a 12.6% increase in revenue compared to the first half of 2021.
BNSF has historically been a critical link in the shipment of coal from the Powder River Basin located in Wyoming and Montana to coal-fired power plants. The Powder River basin is the largest coal producing region of the United States, but production has been in decline for several years as we can see from this chart:
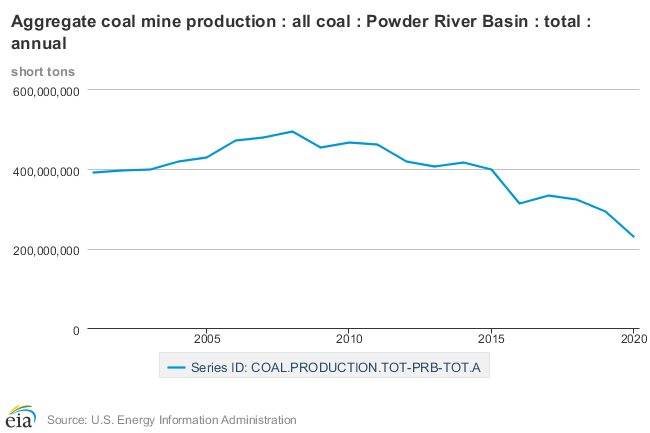
Powder River Basin coal production dropped from 468 million short tons in 2010 to 230 million short tons in 2020 and further declines seem inevitable as the United States moves away from coal burning power plants. As a percentage of BNSF’s freight revenue, coal has dropped from 27% in 2010 to 16% in the first half of 2022. However, average revenue per carload of coal has increased from $1,812 in 2010 to $2,487 in the first half of 2022 which has mitigated the revenue decline. Fortunately, both physical volume and average revenue per carload of all other product categories has increased since 2010, more than offsetting the revenue decline due to the coal.
Let’s turn our attention to operating expenses, operating income, and net income:

The major operating costs for BNSF include compensation for the company’s 35,000 employees, diesel fuel to run the company’s 7,500 locomotives, purchased services, depreciation of physical infrastructure, equipment rents, and materials.
Long term debt has more than doubled since the acquisition leading to an increase in interest expense. Prior to the tax cuts that took effect in 2018, BNSF had a tax rate of ~37% but this has fallen to ~24% since 2018. The large non-recurring tax benefit that boosted net income in 2017 was a one-time effect due to applying the reduced federal corporate income tax to BNSF’s deferred tax liability.
Let’s take a closer look at operating expense line items as a percentage of revenue:

Most of the expense line items are relatively constant and move around only slowly over time. The exception is that fuel costs jump around a great deal depending on the cost of diesel fuel during a given year. However, BNSF is able to pass through a significant portion of fuel costs above a certain threshold. The company has a fuel surcharge program that recoups fuel costs when the price of diesel is high. Fuel surcharge revenue is recorded as a component of freight revenue and the full cost of fuel is recorded as an expense. However, it is useful to consider the net effect of fuel surcharges and expenses over time, as shown in the following exhibit:

The fuel surcharge program dampens the volatility of diesel prices and makes BNSF’s operating income less sensitive to fuel prices. However, rather than thinking about “net” fuel costs to BNSF, I view surcharges as a manifestation of pricing power. BNSF is able to effectively charge higher freight rates when fuel costs are high, thereby shifting a significant component of the risk of fuel price volatility to customers.
Analysts focus on a railroad’s operating ratio to measure its overall efficiency. The operating ratio is calculated by dividing railroad operating expenses by railroad operating income.10 This is a key metric of the overall efficiency. Railroad management seeks to drive the operating ratio down consistent with maintaining a cost structure that allows the company to maintain overall customer satisfaction.
The operating ratio is presented in tabular format above, but a graph is useful to visualize the extent of improvement over the years:

Although BNSF has improved its operating ratio significantly, it should be noted that Union Pacific has posted operating ratios of 57.2%, 59.9%, and 60.6% for 2021, 2020, and 2019 respectively.11 Union Pacific has implemented a system known as Precision Scheduled Railroading (PSR) in order to improve efficiencies, a step that BNSF has not taken. The question of whether BNSF should adopt PSR has come up at several annual meetings and Warren Buffett has commented at other times as well. While Berkshire appears open to considering adoption of PSR in the future, Mr. Buffett has noted that the operating ratio has declined without implementing PSR while BNSF has taken market share and maintained customer satisfaction.
While BNSF’s operating income has progressed at a steady clip due to an improving operating ratio, net income has been turbocharged by tax cuts that took place in 2018. The chart below shows operating income and net income since 2010 (figures in millions):
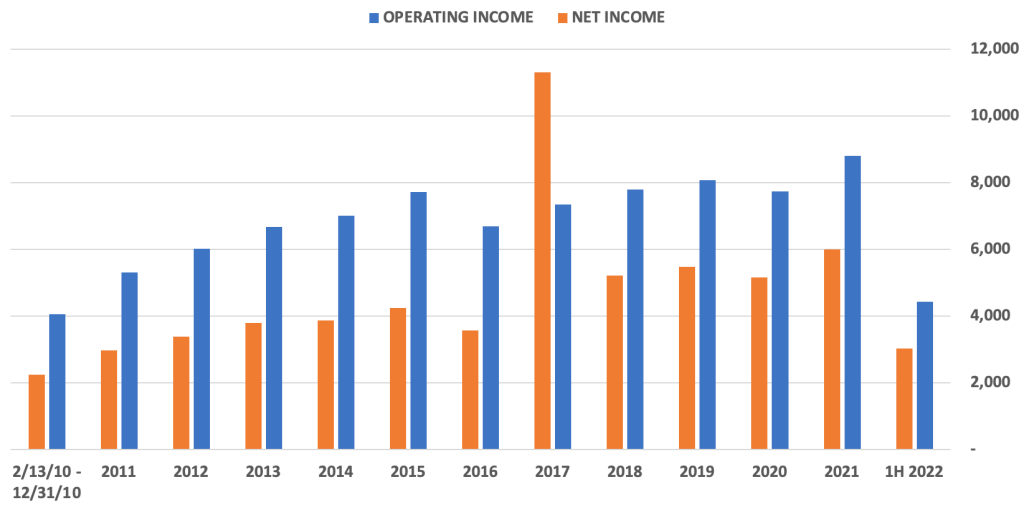
In total, from February 13, 2010 to June 30, 2022, BNSF generated $87.6 billion of operating income, $77.3 billion of pre-tax income, and $60.2 billion of net income.
While Mr. Buffett might have anticipated the boost to operating income from greater operating efficiencies, he could not have anticipated the tax cuts. From 2018 through the first half of 2022, BNSF’s cumulative pre-tax income was $32.7 billion, net income was $24.9 billion and the average tax rate was ~24%. If the tax rate during this period had been the ~37% average that prevailed prior to 2017, cumulative net income from 2018 through the first half of 2022 would have been just ~$20.6 billion! The change in the tax code has made BNSF much more valuable for Berkshire shareholders.
Balance Sheet Review
The following exhibit is a condensed version of BNSF’s balance sheet since the acquisition which allows us to make some observations related to the capital structure.

Property and equipment has been the primary driver of the increase in assets in the years since the acquisition. The higher asset base has been funded by roughly equal increases in equity and long-term debt. The increase in debt mostly took place during the first five years following the acquisition. Long-term debt stood at $10.4 billion shortly after the acquisition and grew to $22.5 billion as of June 30, 2022.
BNSF’s 2021 10-K provides detail regarding the composition of the company’s debt, excluding finance leases, as of December 31, 2021:

Near term debt maturities are clearly manageable using free cash flow, although it is nearly certain that new debt will be issued to pay off maturating debt. Debt as a percentage of total capital is higher than after the acquisition but clearly reasonable given the cash generation power of the business. I will make some additional observations regarding the additional debt in the capital allocation section below.
Cash Flow Generation
The following exhibit is a condensed version of BNSF’s cash flow statement for each year since the acquisition took place as well as the first half of 2022. At a high level, we can see that BNSF produced $82.7 billion of cash flows from operations, spent $45.5 billion on capital expenditures, raised $13.4 billion in net long-term debt, and distributed $47.7 billion to Berkshire.

Warren Buffett expected BNSF to invest tens of billions of dollars over the years toward maintaining its infrastructure and this has taken place. It is necessary to fulfill the “social compact” that comes with owning infrastructure that is so critical to the United States economy, as Mr. Buffett pointed out in his 2009 letter to shareholders:
“We see a ‘social compact’ existing between the public and our railroad business, just as is the case with our utilities. If either side shirks its obligations, both sides will inevitably suffer. Therefore, both parties to the compact should – and we believe will – understand the benefit of behaving in a way that encourages good behavior by the other. It is inconceivable that our country will realize anything close to its full economic potential without its possessing first-class electricity and railroad systems. We will do our part to see that they exist.”
As we discussed previously, BNSF produced $60.2 billion of net income during Berkshire’s ownership. However, net income significantly overstates free cash flow because depreciation expense is routinely far lower than capital expenditures. During Berkshire’s ownership of BNSF, depreciation totaled $26.7 billion while capital expenditures totaled $45.5 billion.
Depreciation is calculated based on the historical cost of BNSF’s asset base whereas capital expenditures reflect replacement cost. Inflation guarantees that replacement cost will exceed depreciation. As a result, we must look at free cash flow rather than net income when it comes to cash that can be safely taken out of the business.
The exhibit below shows BNSF’s free cash flow during Berkshire’s ownership:

When we deduct capital expenditures from cash flows from operations, we arrive at a cumulative total of $37.2 billion of free cash flow. The cash can safely be regarded as distributable to Berkshire without adversely affecting the soundness of BNSF’s physical infrastructure.
The nature of long-lived assets such as track structures and locomotives is such that management could get away with underinvesting in capital expenditures for a period of time without noticeable ill effects, but satisfying the “social compact” requires sufficient investment over time.
Although BNSF does not publish as much information regarding its capital expenditures as it would if it was a public company, Berkshire shareholders should be confident that the railroad is not underinvesting. There is no pressure to meet quarterly earnings expectations at BNSF. As a subsidiary of Berkshire Hathaway, BNSF can take a much longer term view compared to public companies.
Capital Allocation
Although I have touched on how BNSF management has allocated capital toward capital expenditures, that is only part of the situation that we should analyze. Assuming that the railroad is allocating sufficient funds to capital expenditures to maintain its infrastructure, free cash flow should be safely distributable to Berkshire.
Indeed, BNSF has paid distributions to Berkshire accounting for all free cash generated since the acquisition plus a considerable additional amount. Let’s take a look at how this was accomplished and then consider why Warren Buffett has been treating BNSF as a cash cow, something that has surprised many observers.
The left side of the following exhibit shows the distributions from BNSF to Berkshire and the right side shows the distributions plotted against free cash flow.
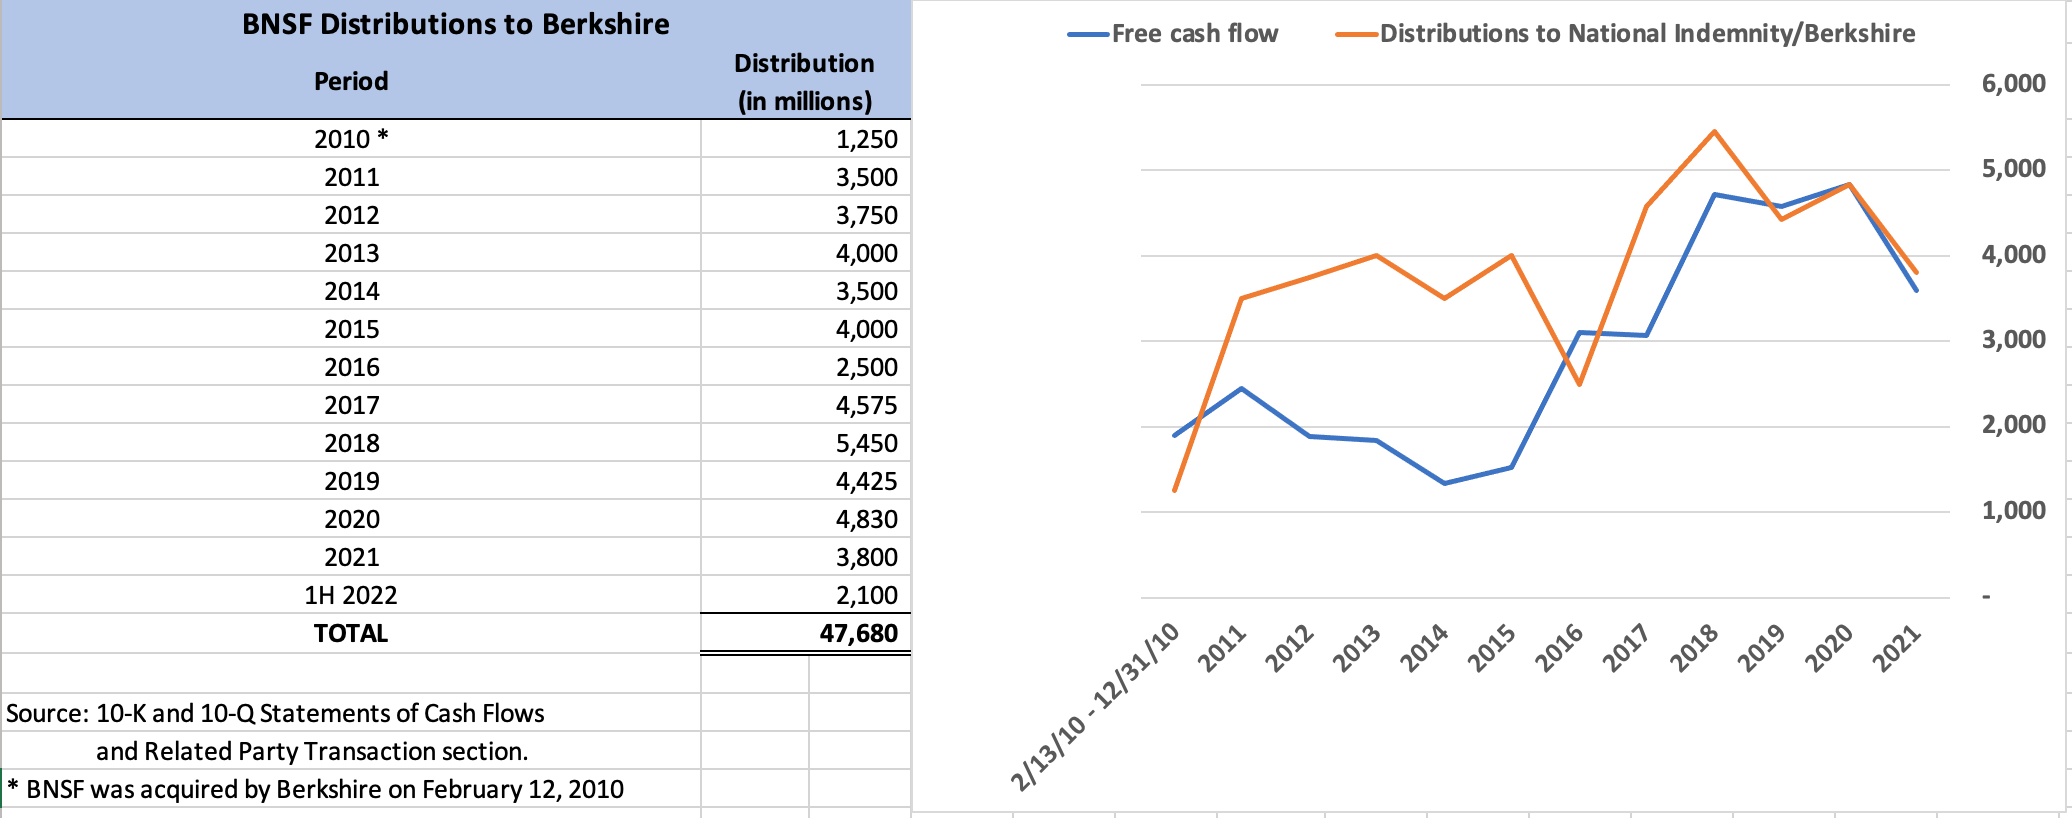
We can see that in the first few years after the acquisition, BNSF paid distributions to Berkshire far in excess of free cash flow. During those years, BNSF took on additional long-term debt. In recent years, the distributions to Berkshire have more closely approximated free cash flow. In total, cumulative free cash flow was $37.2 billion, distributions to Berkshire totaled $47.7 billion, and net cash flows from long-term debt totaled $13.4 billion.
In order to understand the additional debt as well as the early distributions to Berkshire, we need to understand some history regarding the acquisition. As the first exhibit in this article showed, the cash component of the acquisition was $15.9 billion. About half of this $15.9 billion came from Berkshire’s cash on hand and the other half came from new debt issued by Berkshire.
My theory is that Mr. Buffett wanted to effectively shift the debt incurred for the acquisition from Berkshire’s balance sheet to BNSF’s balance sheet. This was accomplished by increasing BNSF’s long-term debt and distributing cash to Berkshire during the early years. It makes logical sense to have this debt on BNSF’s balance sheet rather than Berkshire’s because BNSF’s debt is non-recourse to Berkshire.
So, the early large distributions make quite a bit of sense and are not particularly surprising. However, the distributions have continued ever since. This is surprising because many observers believed that BNSF would retain far more of its earnings and might even be a destination for additional investment from Berkshire in the long run.
Why would observers have had this impression? Both Mr. Buffett and Matthew Rose, BNSF’s CEO at the time of the acquisition, seemed to imply that there would be significant reinvestment. In his 2009 letter to shareholders, Mr. Buffett explained that BNSF and Berkshire Hathaway Energy would share a similar approach to reinvestment of earnings:
“In the future, BNSF results will be included in this ‘regulated utility’ section. Aside from the two businesses having similar underlying economic characteristics, both are logical users of substantial amounts of debt that is not guaranteed by Berkshire. Both will retain most of their earnings. Both will earn and invest large sums in good times or bad, though the railroad will display the greater cyclicality. Overall, we expect this regulated sector to deliver significantly increased earnings over time, albeit at the cost of our investing many tens – yes, tens – of billions of dollars of incremental equity capital.”
In an interview in April 2010, Mr. Rose made the following comments:
“There is no doubt that Warren has been very clear he wants to us reinvest in the railroad. And if you think about, if you are a public company, in terms of generating free cash flow, you really have three different alternatives. Buy back your stock. Dividend out to your shareholders or reinvest in your company either your own company or through a strategic acquisition. We no longer can buy back our own stock because we don’t have any so we’re down to dividending up to Berkshire as the parent or reinvesting in our company. And I think Warren’s made it clear that he wants to see us reinvest back in the railroad.”
Clearly, both Mr. Buffett and Mr. Rose intended for free cash flow to be reinvested in the railroad in the long run. While BNSF has allocated $45.5 billion toward capital expenditures since the acquisition while depreciation has only been $26.7 billion, this excess is mostly due to inflation. The cost of replacing assets carried at historical cost is going to result in maintenance capex exceeding depreciation. We have already seen that BNSF has distributed far more than free cash flow to Berkshire over the years.
It could be that the expected opportunities to redeploy free cash flow more aggressively within the railroad failed to materialize, or Mr. Buffett might have preferred to invest the free cash flow in other opportunities outside the railroad, either in publicly traded equities or other acquisitions. However, it is notable that the large distributions have continued even as Berkshire’s cash balance has swelled well beyond $100 billion. It is an interesting situation and I do not have a fully satisfactory answer regarding the apparent disconnect between what was initially contemplated and what actually transpired.
Conclusion
This article has provided an overview of BNSF’s performance since the acquisition and examined the company’s capital allocation and large distributions of cash to Berkshire over the years. However, I have yet to comment on whether this acquisition was a successful one for Berkshire.
In order to make an assessment, we need to consider the question of whether it was a good idea for Berkshire to issue shares to fund part of the acquisition an act that Warren Buffett likened to being worse that preparing for a colonoscopy. Let’s look back at what Mr. Buffett said about this topic in his 2009 letter to shareholders:
“In our BNSF acquisition, the selling shareholders quite properly evaluated our offer at $100 per share. The cost to us, however, was somewhat higher since 40% of the $100 was delivered in our shares, which Charlie and I believed to be worth more than their market value. Fortunately, we had long owned a substantial amount of BNSF stock that we purchased in the market for cash. All told, therefore, only about 30% of our cost overall was paid with Berkshire shares.
In the end, Charlie and I decided that the disadvantage of paying 30% of the price through stock was offset by the opportunity the acquisition gave us to deploy $22 billion of cash in a business we understood and liked for the long term. It has the additional virtue of being run by Matt Rose, whom we trust and admire. We also like the prospect of investing additional billions over the years at reasonable rates of return. But the final decision was a close one. If we had needed to use more stock to make the acquisition, it would in fact have made no sense. We would have then been giving up more than we were getting.”
Berkshire issued 80,931 Class A shares and 20,976,621 Class B shares (94,915 Class A equivalents) that had a market value of $10.6 billion on the date of the acquisition. Those shares would be worth $42.5 billion as of August 25, 2022. So, clearly there was an opportunity cost involved in issuing shares.
In 2011, Berkshire initiated a stock repurchase program. Due to restrictions on the price-to-book ratio at which repurchases could be made, few shares were bought back until 2018 when the restriction was lifted. As I’ve documented on several occasions, most recently after Berkshire’s second quarter results, Berkshire has repurchased a considerable amount of stock since 2018. In total, the repurchase program has retired 189,636 Class A Equivalents for $63.9 billion. There are now fewer shares of Berkshire outstanding that prior to the BNSF acquisition, although the shares were repurchased at prices substantially higher than the share price on the date of the acquisition.
Perhaps it is a form of mental accounting to think of the share issuance for the BNSF acquisition in conjunction with Berkshire’s subsequent repurchase program. The important question is whether Berkshire received as much value as it gave. From that perspective, we can look at the $47.7 billion of cash that BNSF has distributed to Berkshire since the acquisition along with the fact that Berkshire continues to own 100% of the railroad today.
If BNSF was a publicly traded company, it would no doubt trade at a multiple of its $33 billion acquisition cost. We can look at Union Pacific as a rough comparable company that is publicly traded. A full analysis of Union Pacific is well beyond the scope of this already lengthy article, although I am considering a profile of Union Pacific for a future article. But to ballpark the situation, Union Pacific had net income of $6.5 billion in 2021 and has a market capitalization of $149 billion as of August 25, 2022. If we take the same multiple of ~23x 2021 net income for BNSF, its market value could be ~$138 billion if it was publicly traded.
So was Berkshire’s acquisition of BNSF successful?
Clearly, it was very successful.
Berkshire invested $22.5 billion of cash and issued stock with market value of $10.6 billion to acquire BNSF in February 2010. From that date through June 30, 2022, BNSF distributed $47.7 billion of cash to Berkshire which still owns 100% of a railroad that likely has a current market value of ~$138 billion. Even if one wishes to apply a more conservative multiple to net income, it is obvious that BNSF is worth multiples of its purchase price. Yes, Berkshire had to issue stock that today would be worth $42.5 billion, but clearly far more was received in exchange for this dilution.
Looking ahead, the two major tailwinds that have driven an improving bottom line at BNSF over the past dozen years are unlikely to continue. There are limits to how much lower the operating ratio can go without harming customer satisfaction and we are almost certain not to get another major cut in the corporate tax rate.
If there is one weakness in BNSF’s trajectory, it is relatively slow revenue growth. In order to grow its bottom line, along with free cash flow generation capabilities, BNSF will likely have to drive higher top line revenue growth. The long-term decline in coal shipments is unlikely to reverse, so BNSF will have to find other ways to increase revenue. As a Berkshire shareholder, I’m looking forward to following what BNSF can accomplish in the coming decades.
Downloads
A PDF file containing this profile can be downloaded by using the link below:

Excel data used in this report is now available using the link below:
Copyright, Disclosures, and Privacy Information
Nothing in this newsletter constitutes investment advice and all content is subject to the copyright and disclaimer policy of The Rational Walk LLC.
Your privacy is taken very seriously. No email addresses or any other subscriber information is ever sold or provided to third parties. If you choose to unsubscribe at any time, you will no longer receive any further communications of any kind.
The Rational Walk is a participant in the Amazon Services LLC Associates Program, an affiliate advertising program designed to provide a means for sites to earn advertising fees by advertising and linking to Amazon.com.
Individuals associated with The Rational walk own shares of Berkshire Hathaway.
- For more on the similarities between John D. Rockefeller’s role as a sort of “national cheerleader” after the 1929 crash and Warren Buffett’s role during the 2008 financial crisis, see Berkshire Hathaway: In Search of the Buffett Premium, p. 11-15. [↩]
- Berkshire Hathaway’s 2010 annual report, Note 2, p. 41 [↩]
- Page 41 of Berkshire Hathaway’s 2010 annual report lists the purchase price as $34,495 million. The table in this article presents the cost basis as $33,049 million. The difference is due to the fact that Berkshire remeasured the value of its 22.5% stake in BNSF at market value immediately prior to the closing of the acquisition whereas I am using Berkshire’s carrying value of $6.6 billion, which approximates its cost basis. When Berkshire began accumulative BNSF shares in 2006, it carried the investment at market value. Starting in the fourth quarter of 2008, Berkshire began to account for BNSF using the equity method of accounting because its stake in BNSF exceeded 20%. Under the equity method of accounting, BNSF shares were no longer carried at market value. Immediately prior to the completion of the acquisition, carrying value was $6.6 billion whereas the market value of Berkshire’s 76,777,029 shares of BNSF were valued at $100 per share, or ~$7.7 billion. [↩]
- Berkshire’s National Indemnity insurance subsidiary is BNSF’s parent company. However, throughout this article I refer to BNSF paying distributions to Berkshire because that is the substance of what is happening. When cash is paid to National Indemnity, it is available to Warren Buffett for other investment purposes or, subject to regulatory approval, for distribution upstream to Berkshire Hathaway at the parent company level. National Indemnity files annual regulatory statements which confirm distributions received from BNSF and distributions paid upstream to Berkshire. For example, National Indemnity’s 2021 annual report filed with the California Department of Insurance reveals that BNSF distributed $3.8 billion to National Indemnity and National Indemnity distributed $7.4 billion upstream to Berkshire during 2021. BNSF’s distributions do not appear to be “trapped” within National Indemnity, and are available for Berkshire to reallocate. [↩]
- The Rational Walk has a Berkshire Hathaway resource page with a selection of articles about the company. In addition, there is a full archive of Berkshire-related content. [↩]
- BNSF’s history dates back to the 1849 founding of the Aurora Branch Railroad and the Pacific Railroad of Missouri. The mid-19th century was an era of enthusiasm for exploration of the Western United States and this trend was accelerated by the rise of the railroads. Small railroads proliferated and began to combine almost immediately, a process of consolidation that continued into the 20th century. BNSF has published The History of BNSF: A Legacy for the 21st Century. which will fascinate those who are interested in railroad history. [↩]
- Warren Buffett’s 2021 letter to shareholders [↩]
- BNSF Factsheet, August 2022. [↩]
- BNSF trains can move one ton of freight more than 480 miles on just one gallon of diesel fuel. This is estimated to be three to four times as efficient as moving freight by truck. Source: BNSF: Orange is the New Green [↩]
- We could derive the operating ratio directly from BNSF’s reported operating expenses and operating income, but one complication involves BNSF Logistics, a subsidiary that provides supply chain solutions extending beyond rail transportation. While recent BNSF financial statements segregate revenue from BNSF Logistics, operating expenses attributable to BNSF Logistics are not separately broken out in BNSF’s financials. Starting in 2018, Berkshire’s financials provide sufficient data to calculate the operating ratio and prior to that point, I have obtained data from BNSF’s filings with the Surface Transportation Board. [↩]
- Union Pacific’s 2021 10-K [↩]