
A closer look at GEICO, Repurchases, and Greg Abel’s BHE sale
Berkshire Hathaway reported second quarter results in a press release on Saturday, August 6 and also released a 10-Q report. The company posted a net loss of $43.8 billion in the second quarter of 2022 compared to net income of $28.1 billion in the second quarter of 2021. For the first six months of 2022, net loss was $38.3 billion compared to net income of $39.8 billion for the first six months of 2021. These swings in net income were primarily attributable to large investment losses during the first half of 2022 compared to large investment gains during the first half of 2021.
As I wrote yesterday in Berkshire Hathaway’s Distorted Quarterly Results, net income is a particularly volatile measure for evaluating the company’s economic results over short periods of time. It makes more sense for shareholders to delve into the specifics of each of Berkshire’s reportable segments.
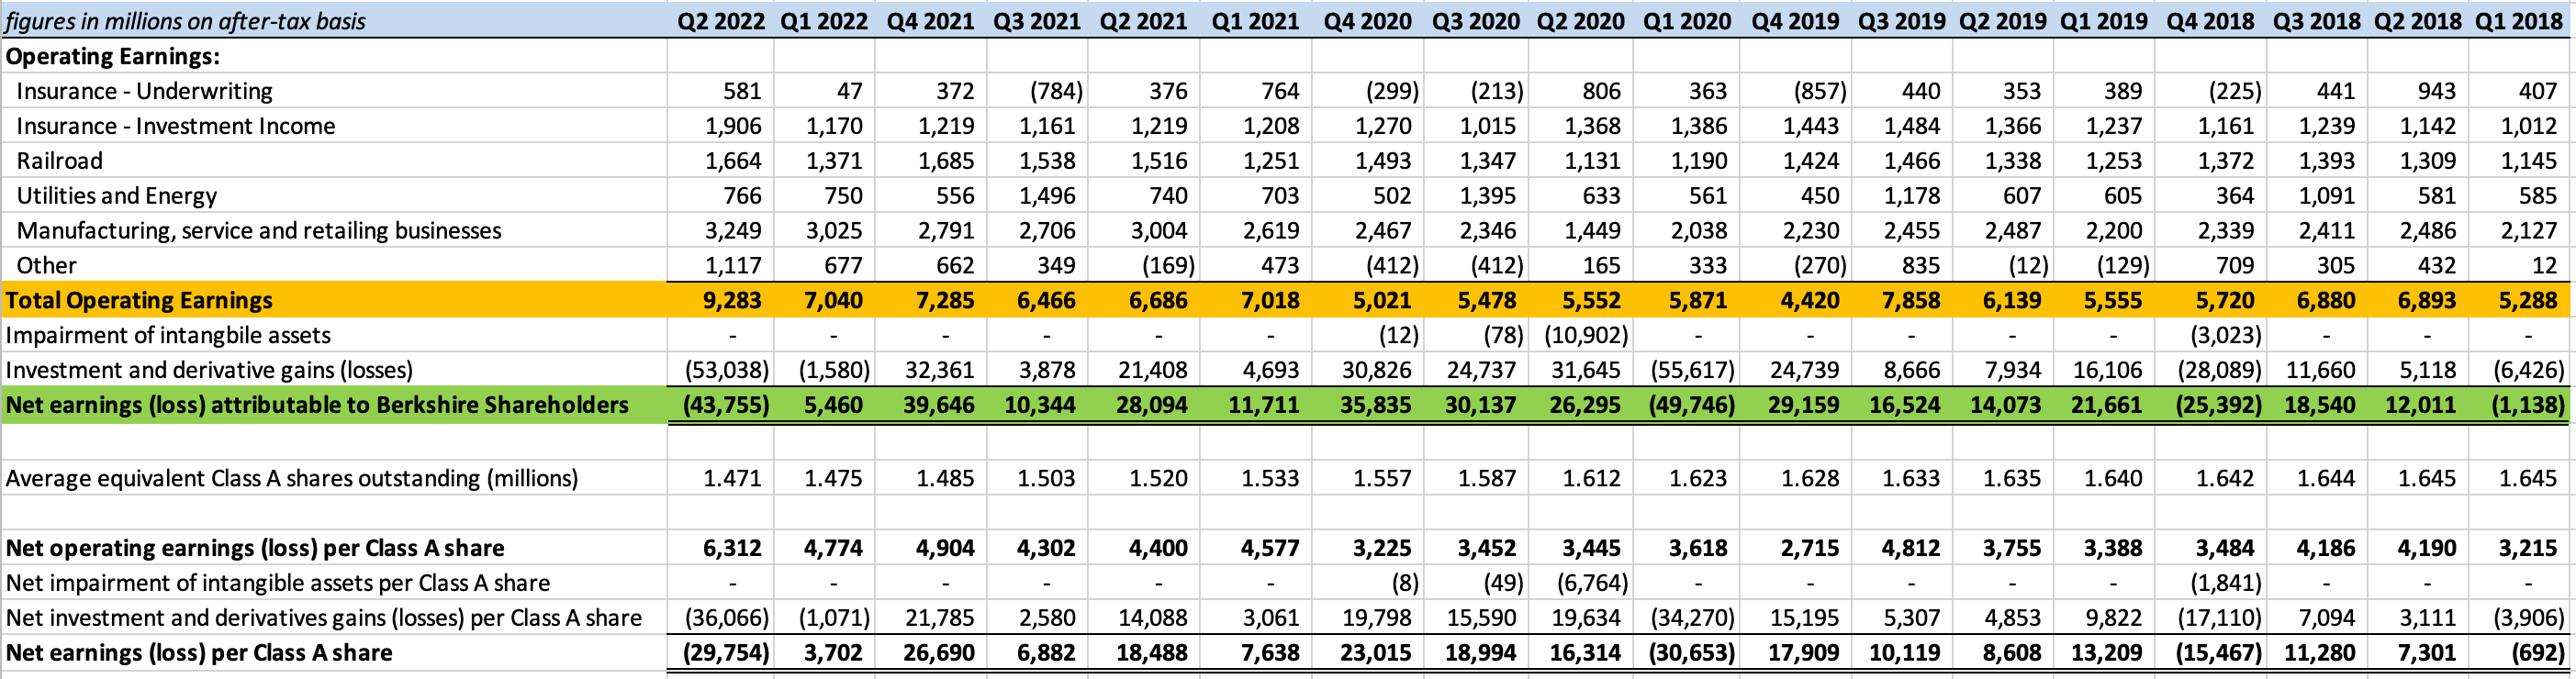
Berkshire reports net operating earnings to segregate results from the company’s business operations from investment results. The company posted net operating income of $9.3 billion in the second quarter of 2022 compared to net operating income of $6.7 billion in the second quarter of 2021. For the first six months of 2022, net operating income was $16.3 billion compared to net operating income of $13.7 billion for the first six months of 2021. The exhibit below shows quarterly results since 2018, with figures provided on an after-tax basis (click on the image for a larger view):
Yesterday’s article was a high level look comparable to being in a plane cruising at 30,000 feet looking down at the landscape below. In this article, I will go into more detail in a few areas that seem to warrant a closer look.
The article is divided into three parts:
- GEICO
- Share Repurchase Activity
- Greg Abel’s BHE Sale
GEICO
In April, I wrote Auto Insurance Competitive Dynamics which surveyed recent market share trends in the industry with a primary focus on the competition between GEICO and Progressive. The article included a table, replicated below, showing earned premiums, underwriting profits, loss ratios, expense ratio, and combined ratios for GEICO and Progressive on an annual basis over the past two decades. Both are phenomenal businesses and now have very similar market shares after years of gains. Only State Farm has a larger share of the auto insurance market, and it seems likely that either GEICO or Progressive will become the number one auto insurer in the United States by the end of the decade.

The consistency of GEICO’s underwriting profitability is notable. Other than a small underwriting loss in 2017, the company has posted underwriting gains in every year presented in the table. In aggregate, GEICO generated $21.2 billion of underwriting profits from 2001 to 2021.
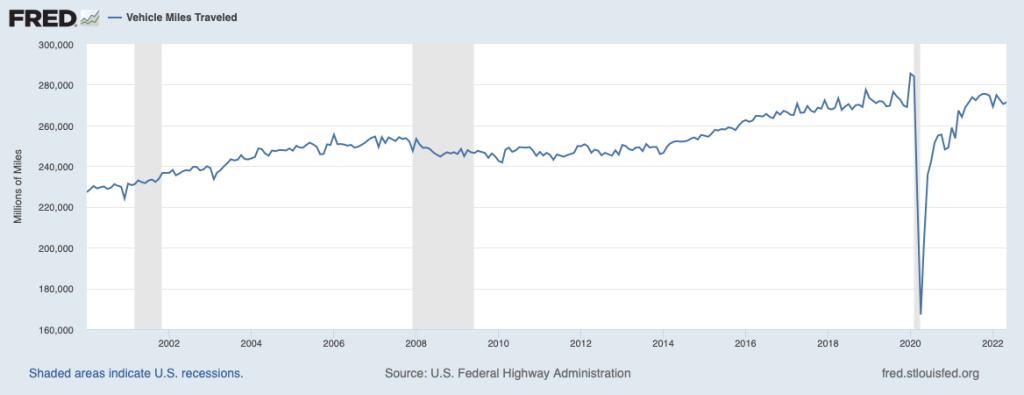
It is precisely because underwriting profits appear like clockwork for GEICO that recent trends in the business are cause for some concern. The pandemic had significant effects on the auto insurance industry because the initial lockdowns starting in March 2020 dramatically curtailed traffic. As I noted last week in The Automobile Industry, vehicle miles traveled plummeted starting in March 2020 before partially recovering. Over the past few quarters, miles traveled have approximated pre-pandemic levels, as we can see below:
The exhibit below shows GEICO’s results over the eighteen quarters since the start of 2018. This encompasses a period of relative normalcy followed by the effects of the pandemic and the subsequent recovery (click on the image for a larger view):

In general, a quarter is not a long enough period of time to see meaningful trends, but the period surrounding the pandemic is an exception. GEICO was generating consistent underwriting profits until the end of 2019 when it posted a small underwriting loss. Then, results skyrocketed, peaking in the second quarter of 2020 with over $2 billion of underwriting profits. We can see that the loss ratio plummeted to 62.1% during that quarter leading to a very low 77.2% combined ratio.
The pandemic lockdowns dramatically reduced commuting and fewer miles traveled naturally translated into fewer accidents. At the same time, the premiums that were being earned were based on rates that assumed that miles traveled would remain relatively constant. This was a recipe for abnormally high profitability.
Alas, this happy state of affairs from the perspective of an auto insurance company could not last. Policyholders were not happy continuing to pay premiums while cutting back drastically on driving. Regulators and politicians also took notice. In April 2020, GEICO announced a policy of insurance credits known as the “GEICO Giveback Program”. The total value of the credits was estimated to be $2.5 billion, and the impact of the program would begin to be felt later in 2020.
Moving into 2021, drivers were back on the road, the Giveback Program was pressuring financial results, and the general rate of inflation was starting to rise. Inflation in used cars was particularly acute, as I described recently in the article on the auto industry. The chart below, replicated from that article, shows the jump in the price of used vehicles starting in mid 2020 and accelerating in early 2021:
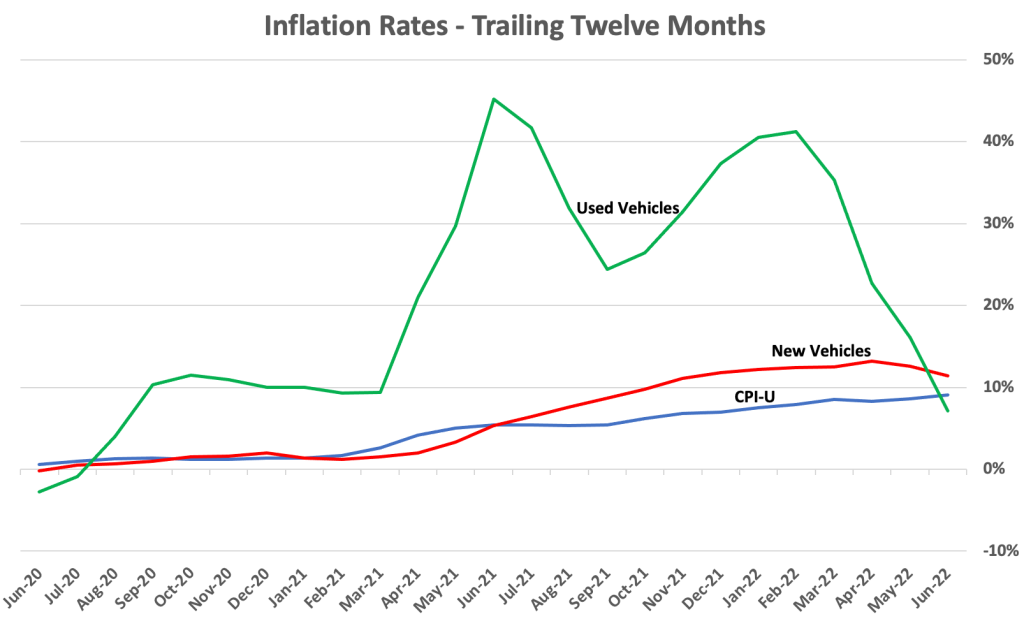
Auto insurers provide coverage to policyholders against damage to their vehicles, damage to the vehicles of other drivers, as well as liability and personal injury protection. As the general rate of inflation rose, the cost to repair vehicles rose. More importantly, policyholders who “totaled” their vehicle had to be made whole with payouts reflecting the replacement cost of the lost vehicle. When used car prices began to rise, the cost of paying out claims for totaled vehicles rose commensurately.
GEICO’s underwriting results swung to a loss starting in the third quarter of 2021 and the company has now posted four consecutive quarters of underwriting losses. To better understand the situation, we need to look at the components of the combined ratio: the loss ratio and the expense ratio.
Let’s take a look at the loss ratio first. The loss ratio is calculated as loss and loss adjustment expenses divided by earned premiums:

In recent years, GEICO’s loss ratio has typically ranged from the high 70s to the low 80s. However, the loss ratio jumped up to the high 80s starting in the third quarter of 2021 and spiked up to 92.8% for the second quarter of 2022. This means that for every $100 in earned premiums, $92.80 was needed to cover estimated losses.
Berkshire’s second quarter report indicates that increases in claim frequencies and severities accounted for the rise in the loss ratio. Claims frequencies were higher for all coverage lines including property damage, collision, bodily injury, and personal injury. Claims severities were higher across all lines. This means that there were more claims, and that claims, on average, were more severe in terms of the cost of the loss.
Let’s turn our focus to the expense ratio over the same timeframe:

It looks like GEICO’s management has taken steps to control costs and the expense ratio has decreased significantly due to these efforts. While cost-cutting is a natural response during periods of adversity, it is by no means without side effects.
Management has reported that lower advertising costs and lower employee-related costs were responsible for the decline. The automobile insurance industry is highly competitive. GEICO and Progressive have historically been aggressive with advertising in order to build market share. A reduction in advertising expenses could be partly responsible for the decrease in GEICO’s policies-in-force during the quarter.
As a thought experiment, let us consider what GEICO’s second quarter results would have looked like if the expense ratio was 14.5% during the quarter, which is equivalent to the actual expense ratio for 2021. If GEICO’s expense ratio had been 14.5% during the second quarter rather than 12.1%, underwriting expenses would have been $1,422 million rather than $1,189 million, implying additional losses of $233 million.
It is possible that management believes that competition in the industry is resulting in inadequate premiums. If that is the case, more advertising might not pay off if the premiums that GEICO seeks are not competitive. This would be a conscious decision to discourage new inquiries at a time of rate inadequacy. On the other hand, if rates could be set at attractive levels, a reduction of advertising could slow profitable growth. GEICO obviously has highly competent management based on its long-term track record, and my interpretation is that they are purposely not seeking a high level of policy growth in the current competitive environment.
The sum of the loss ratio and the expense ratio is the combined ratio which is shown in the chart below. A combined ratio of under 100% corresponds to an underwriting profit while a ratio over 100% indicates an underwriting loss.

It’s important to keep the underwriting losses of the past four quarters in perspective. Over the eighteen quarters since the start of 2018, cumulative underwriting profits were $7,977 million, and this includes the $1,055 million of underwriting losses over the past four quarters. It is likely that management will take the necessary steps to restore underwriting profitability over the next few quarters.
It is worth noting that Progressive has posted underwriting profits for the first half of 2022. The following exhibit is taken from Progressive’s latest earnings release:
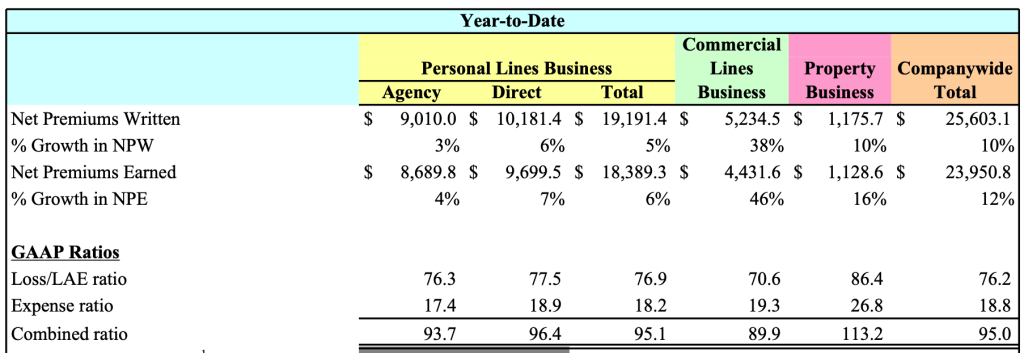
Progressive has posted a much lower loss ratio compared to GEICO in recent quarters, and this has translated into stronger financial results. Progressive reports results on a monthly basis. As a public company, Progressive’s reports contain much more detail than GEICO’s reports as a subsidiary of Berkshire. Accordingly, Berkshire shareholders may find it interesting to follow Progressive to observe trends in the auto insurance market that will also affect GEICO.
Share Repurchase Activity
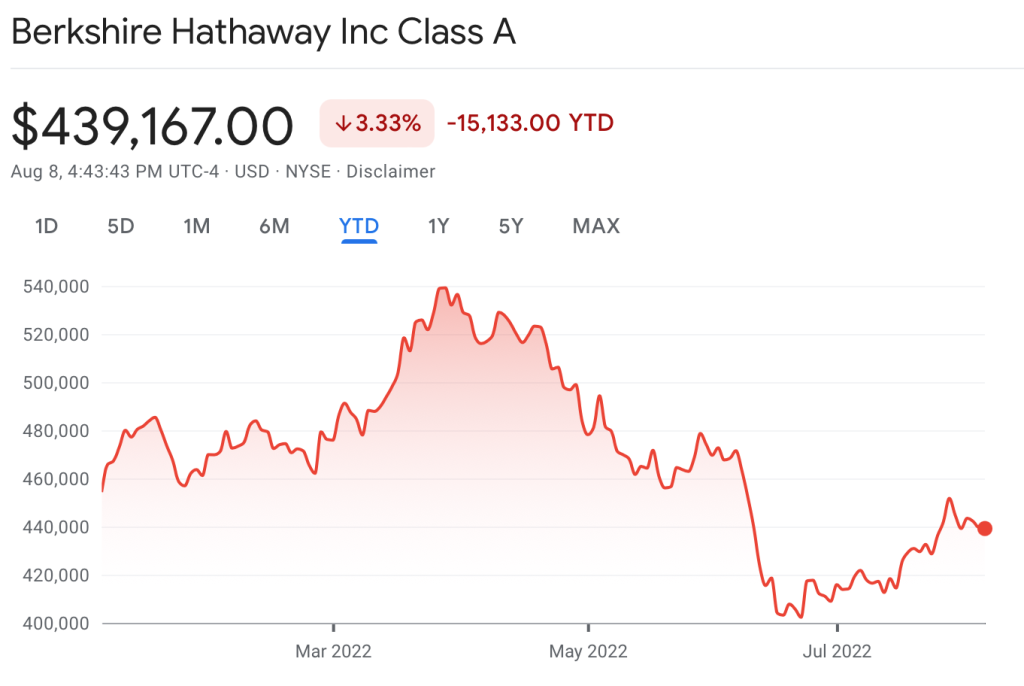
After twenty-three consecutive months of share repurchases, Warren Buffett took a two month break in April and May before resuming buybacks in June. Berkshire’s stock rallied strongly starting in mid-March and set a record high of $544,389 per Class A share on March 29. By late April, the stock dipped back below $500,000. A precipitous decline began on June 7 culminating in a trough on June 23 when the stock hit a low of $396,500. Since then, the stock has moved up to around $440,000.
It is not particularly surprising that Warren Buffett would halt repurchases as the stock price rises. He has always said that repurchases would be price sensitive. However, there could have been other reasons for the temporary pause including Berkshire’s steady accumulation of Occidental Petroleum shares, as I described in Buffett’s Bet on Occidental Petroleum on July 21. Rather than reading the tea leaves regarding the reasons for the pause, let’s just look at the overall record presented in the exhibit below (click on the image for a larger view):
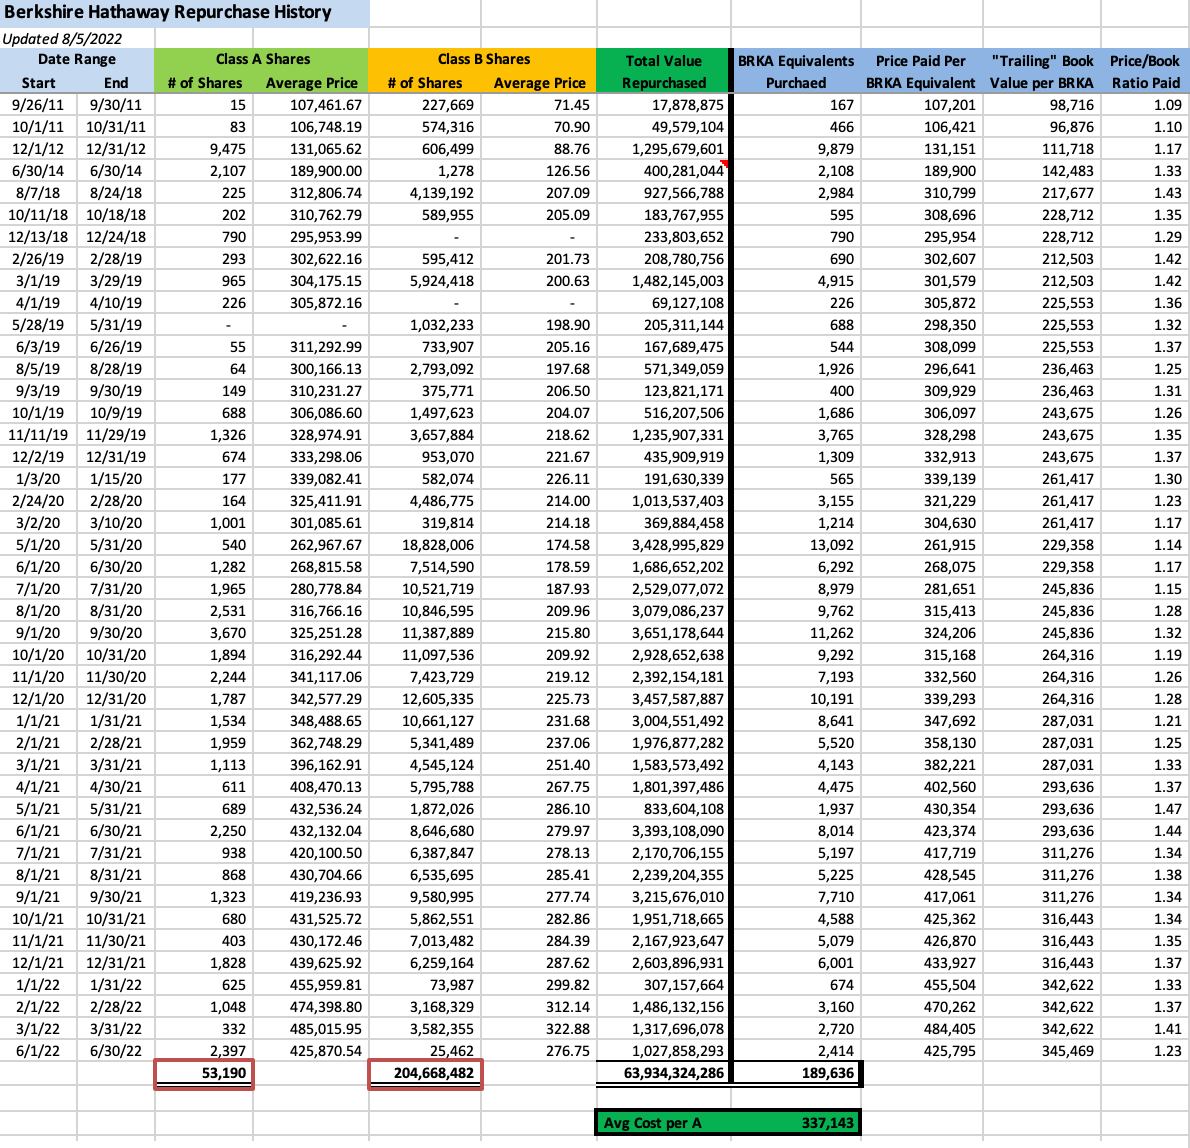
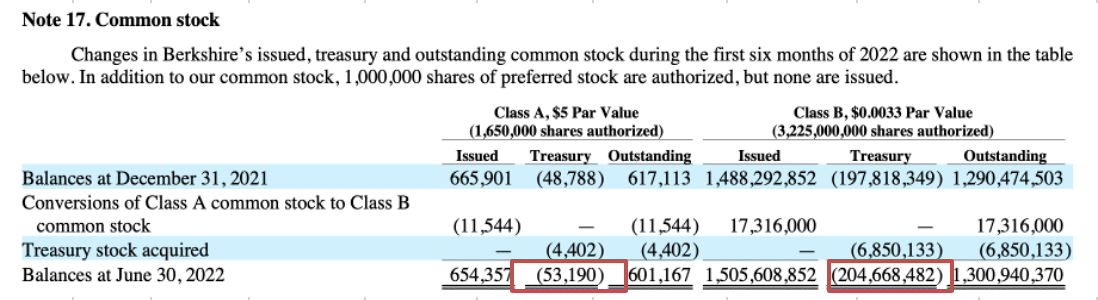
The number of Class A and Class B shares in the exhibit above ties to the information provided Note 17 of Berkshire’s latest 10-Q report.
While some shareholders seem disappointed that the pace of repurchases slowed during the second quarter, we should note that repurchases resumed in June with over $1 billion deployed to repurchase 2,397 Class A shares and 25,462 Class B shares at an average cost of $425,795 per Class A equivalent.
Repurchases continued in July based on an updated share count in the 10-Q of 1,467,342 Class A equivalents as of July 26, down from 1,468,461 as of June 30. This implies that 1,119 Class A equivalents were repurchased between July 1 and July 26. Based on the average price of the stock during this period, those repurchases probably cost Berkshire around $470 million.
It is not surprising that repurchases halted as Berkshire’s stock rallied sharply in April and May, but it is a little surprising that repurchase activity has been muted recently. Berkshire had $101.3 billion of cash and treasury bills on the balance sheet on June 30, so there is plenty of cash on hand to ramp up the repurchase program again.
Greg Abel’s BHE Sale
In April, I wrote How Berkshire Could Deploy $6 Billion which discussed the possibility of Berkshire buying out the minority interests in Berkshire Hathaway Energy (BHE) held by Berkshire Hathaway Vice Chairman Greg Abel and the estate of Walter Scott Jr. who passed away last year. My speculation regarding this possibility turned out to be well founded. BHE repurchased Mr. Abel’s 1% interest in June. However, my estimate of a likely transaction value was too low. Mr. Abel’s stake changed hands at a $870 million valuation, far higher than my $680 million estimate.
Readers who are interested in the specific details of how I came up with the $680 million figure can read the original article. My basic idea was to look at past transactions between Berkshire and Walter Scott to infer valuations for BHE at various points in time. The most recent transaction took place in March 2020 and implied a valuation of BHE of $53.4 billion.
BHE files reports with the SEC separately from Berkshire Hathaway’s reports. BHE’s 10-Q report was filed this morning and indicates that the company purchased 740,961 shares from Mr. Abel for $870 million which implies a price per share of $1,174.15.
BHE’s 10-Q discloses a share count of 75,627,913 as of August 4, 2022. Using the $1,174.15 per share valuation from Mr. Abel’s transaction implies that BHE is valued at $88.8 billion. This is 66.3% higher than the implied valuation of $53.4 billion for BHE in March 2020 based on the transaction with Mr. Scott.
BHE’s total shareholders’ equity was $32.5 billion on March 31, 2020 and $51.2 billion on June 30, 2022, an increase of 57.5%. So it appears that the valuation paid to Mr. Abel is higher on a price-to-book basis. Based on a valuation of $88.8 billion for BHE, a potential buyout of the 8% interest held by the estate of Walter Scott Jr. would cost about $7.1 billion. There is no news indicating that a transaction will take place.
I wrote about Mr. Abel’s interest in BHE in Berkshire’s CEO Succession: A Brief Look at Incentives, published in May 2021 shortly after Charlie Munger indicated that Mr. Abel is the designated successor for Warren Buffett. In that article, I noted that it would be better if Mr. Abel owned Berkshire Hathaway shares rather than BHE shares.
In March of this year, I wrote Berkshire’s Directors Have Skin in the Game in which I again discussed Mr. Abel’s BHE holdings. I noted that he had ample skin in the game even with a concentrated interest in BHE rather than in Berkshire itself. However, with the sale of Mr. Abel’s shares for cash, rather than Berkshire stock, he now has a relatively small position in the company.
I suspect that Mr. Abel will acquire Berkshire shares on the open market with part of the proceeds of his sale of BHE. If he does so, we will likely see a Form 4 filed since he is a director of the Berkshire. Shareholders can monitor Mr. Abel’s SEC filings on the EDGAR system or subscribe to an RSS feed to be notified of new filings.
Copyright, Disclosures, and Privacy Information
Nothing in this newsletter constitutes investment advice and all content is subject to the copyright and disclaimer policy of The Rational Walk LLC.
Your privacy is taken very seriously. No email addresses or any other subscriber information is ever sold or provided to third parties. If you choose to unsubscribe at any time, you will no longer receive any further communications of any kind.
The Rational Walk is a participant in the Amazon Services LLC Associates Program, an affiliate advertising program designed to provide a means for sites to earn advertising fees by advertising and linking to Amazon.com.
Individuals associated with The Rational Walk own shares of Berkshire Hathaway.