
Berkshire Hathaway reported Q3 2022 results over the weekend. This article examines trends in the company’s operating income.
Overview
Berkshire Hathaway reported third quarter results in a press release on Saturday, November 5 and also released a 10-Q report. The company posted a net loss of $2.7 billion in the third quarter of 2022 compared to net income of $10.3 billion in the third quarter of 2021. For the first nine months of 2022, net loss was $41 billion compared to net income of $50.1 billion for the first nine months of 2021.
Berkshire’s net income experiences extreme volatility for reasons that I described in detail in Berkshire Hathaway’s Distorted Quarterly Results. A very brief summary of the article is that accounting rules require Berkshire to include changes in the quoted value of its large equity portfolio as a component of net income. As of September 30, Berkshire held $306.2 billion of equity securities, so even small percentage changes in market prices produce very large swings in net income. This is amplified further when changes in market prices are large, as has been the case in recent quarters.
While the performance of Berkshire’s equity portfolio is very important in the long run, short term swings provide no analytical value and obscure analysis of the performance of Berkshire’s underlying operating businesses. For this reason, Berkshire reports net operating income in addition to net income.
Investors are correct to look askance at companies that offer “adjusted” earnings figures given the abuses that have often taken place. However, when we examine how operating income at Berkshire is presented, it is clear that the intent is not nefarious and is essential for developing sound opinions regarding the health of the business.
The exhibit below shows results for nineteen quarters starting with the first quarter of 2018. A review of this exhibit should illustrate the value of looking at net operating income in addition to net income (click on the image for a larger view):
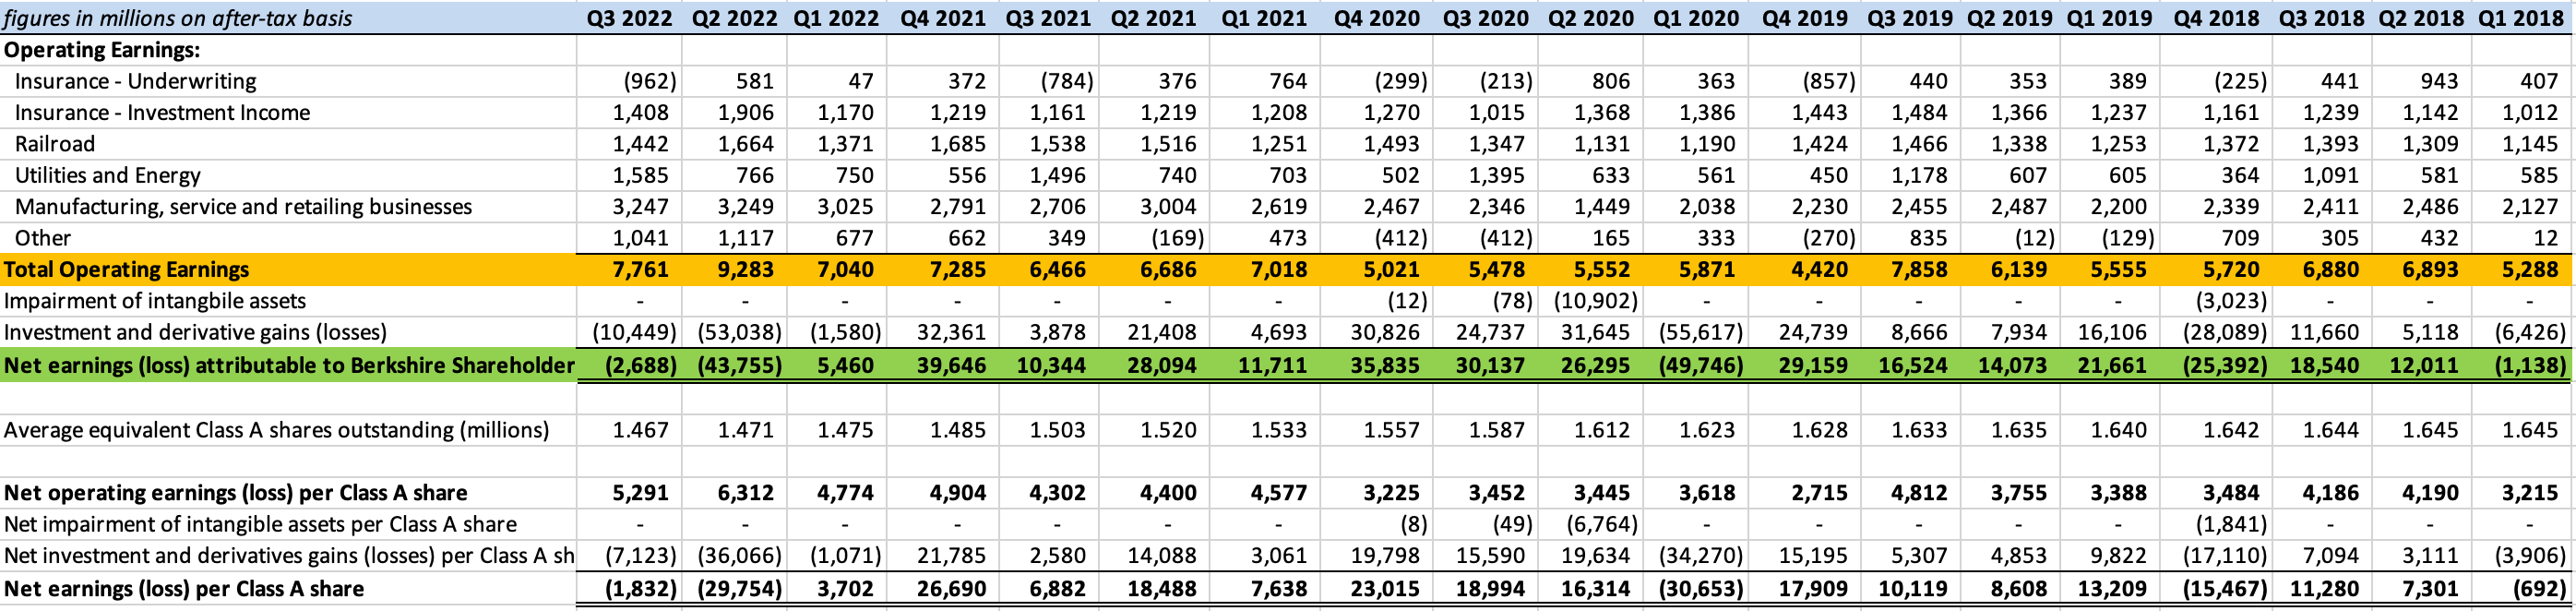
Berkshire reported net operating income of $7,761 million in the third quarter of 2022 compared to net operating income of $6,466 million in the third quarter of 2021. For the first nine months of 2022, net operating income was $24,084 million compared to net operating income of $20,170 million for the first nine months of 2021.
As you can see from the exhibit, investment and derivative gains and losses account for extreme volatility in net income. Over the nineteen quarters in the exhibit, total investment and derivatives gains were $68.6 billion. It makes little sense to look at investment performance except over multi-year periods unless specific fundamental factors have changed materially within the business of a large equity holding.
In this article, I will provide a high level overview of each of the categories of operating income contained in the exhibit, but before doing so, let’s take a look at a few charts the illustrate the volatility of net income and the analytical value of net operating income.
The two exhibits below show net earnings and after-tax operating earnings on a quarterly basis since 2018:


Berkshire’s operating results can be volatile, but this volatility is a function of business fundamentals of the operating businesses rather than market quotations of the equity portfolio. There are cyclical and seasonal variations in operating income. For example, operating income declined during the pandemic and bounced back in the subsequent recovery which is an example of a cyclical variation. Some businesses experience seasonal fluctuations. This is most notable in the Utilities and Energy group which posts higher operating earnings in the third quarter due to higher energy use.
I find it useful to look at operating earnings on a trailing twelve month basis to remove seasonality and better spot underlying trends.
Trailing twelve month earnings are calculated by taking the sum of the prior four quarters for each reporting date. For example, the figures below for 9/30/22 represent the sum of reported results for Q4 2021, Q1 2022, Q2 2022, and Q3 2022.
The exhibits below show trailing twelve month after-tax operating earnings over the past four years, first in tabular form showing each of the reporting groups (click on exhibit to enlarge it) and then in a graph showing total after-tax operating earnings.
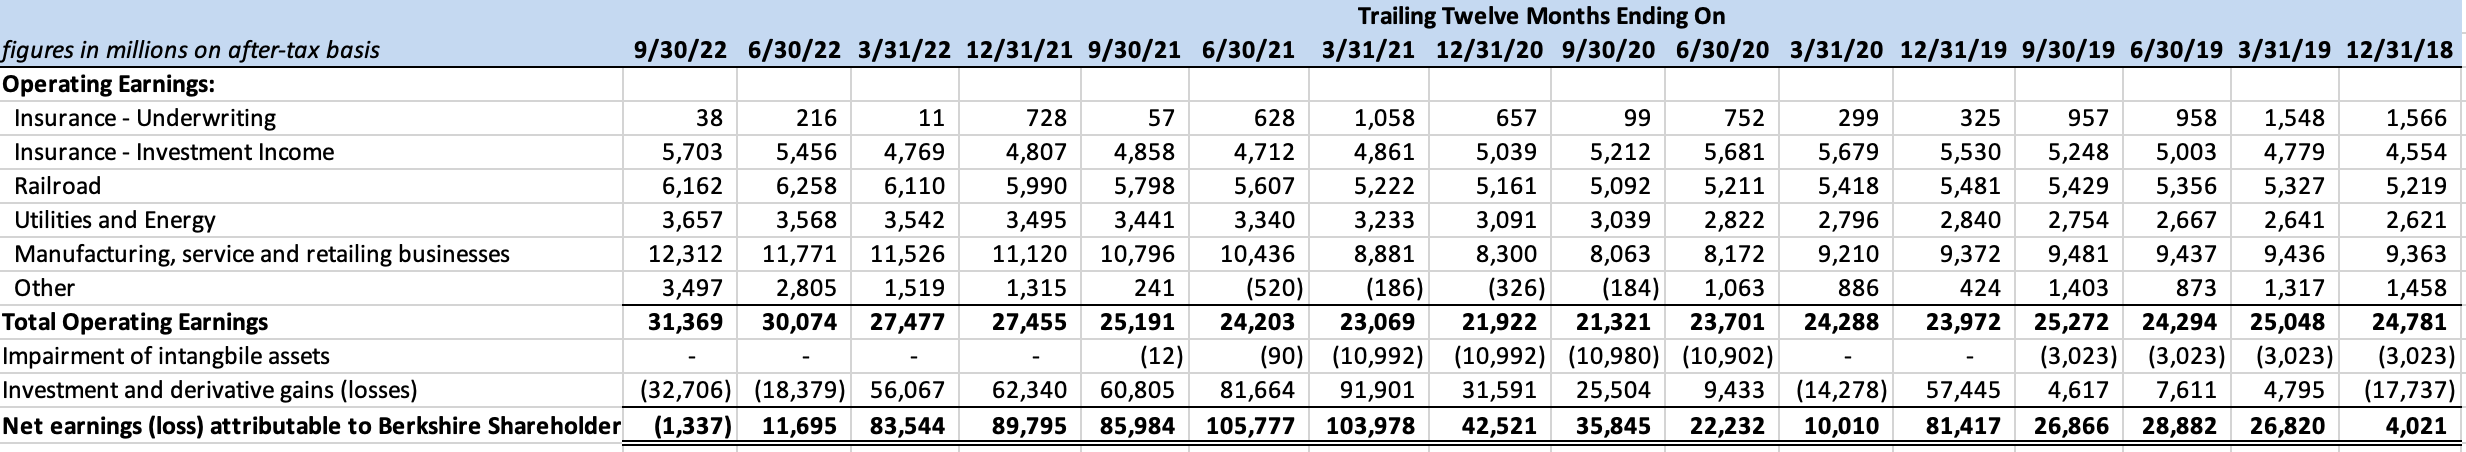
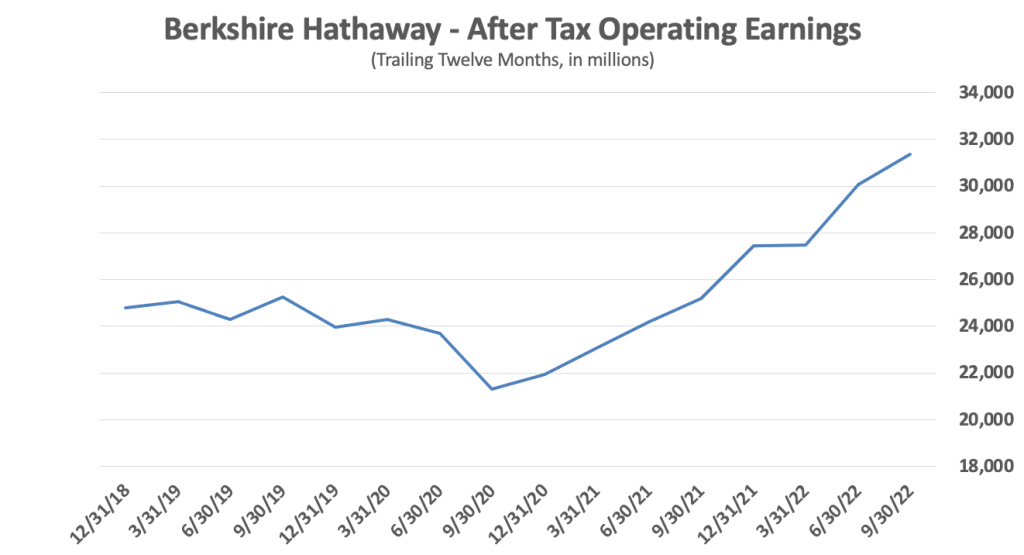
We can see the effect of the pandemic in this exhibit along with the recovery that becomes evident in late 2020. Trailing twelve month net operating income was $31.4 billion as of September 30, 2022. In contrast, trailing twelve month net loss was $1.3 billion due to investment losses of $32.7 billion.
Now that we’ve surveyed the situation at the 30,000 foot level, let’s take a closer look at each of the categories of operating income. To keep this article to a reasonable length, the narrative for each category will be at a fairly high level with the exception of providing more detail regarding GEICO’s recent performance.
I will generally not repeat narratives that can be found in the management’s discussion and analysis section (MD&A) contained within the 10-Q report, instead preferring to keep the commentary at a higher level and covering a longer timeframe.
Insurance – Underwriting
Berkshire posted a net underwriting loss of $962 million for the third quarter and a loss of $334 million for the first nine months of 2022, as seen in the exhibit below:

The exhibit below shows net underwriting earnings since 2018 and provides a sense of the volatility that is inherent in underwriting when examined on a quarterly basis. The cumulative total of underwriting income over this period was $2,942 million, which is an average of $155 million per quarter.
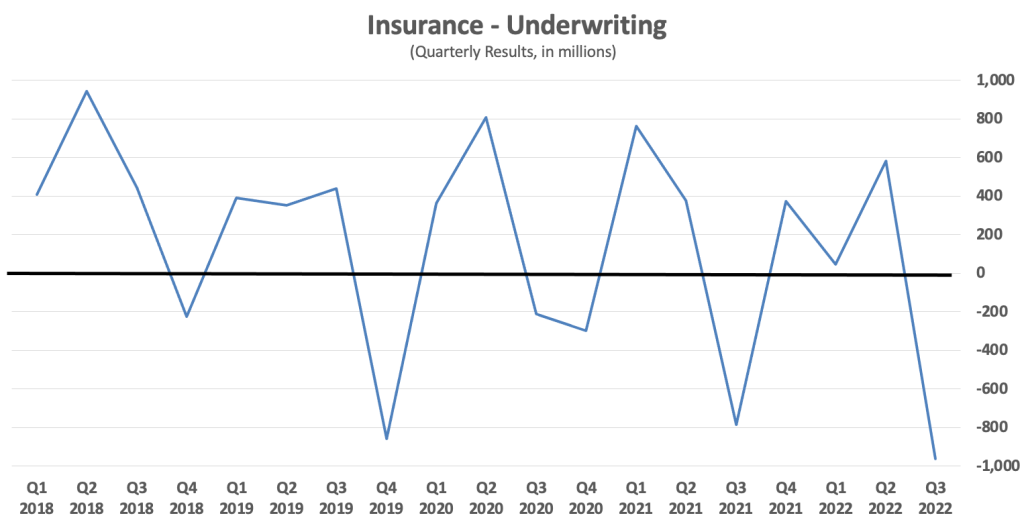
Although total pre-tax underwriting loss for the quarter was $1.15 billion, this figure should be considered in light of pre-tax losses of $3.4 billion attributable to Hurricane Ian which made landfall late in the quarter.
The majority of Berkshire’s underwriting loss for the quarter was at GEICO. Historically, GEICO has been an exceptionally strong performer, posting underwriting profits every year since 2001 with the sole exception of a small underwriting loss in 2017. GEICO’s track record appears in the exhibit below:
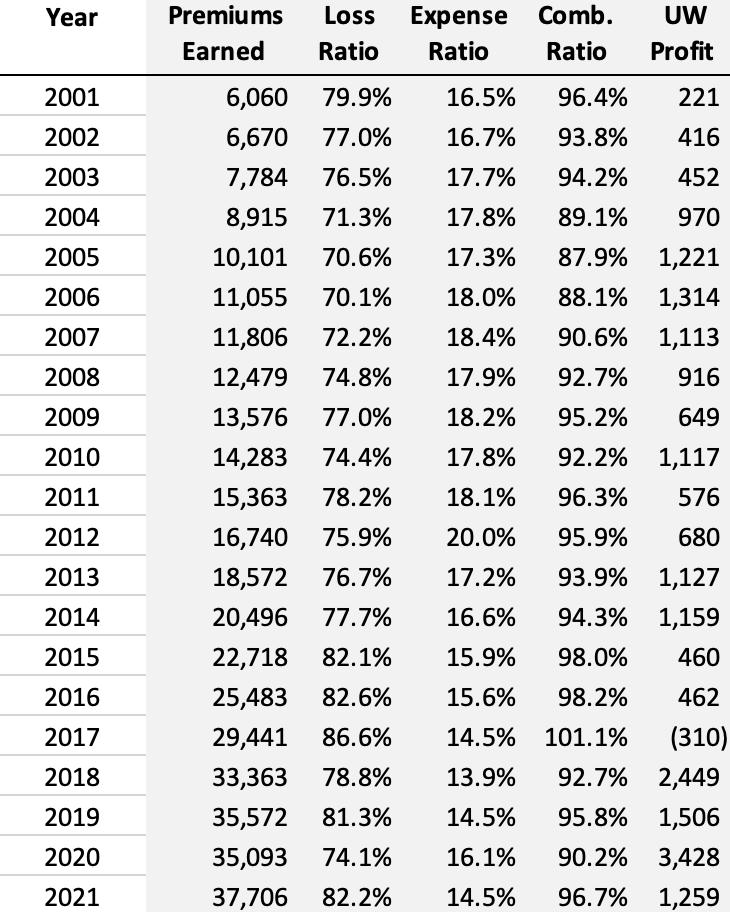
In Auto Insurance Competitive Dynamics published earlier this year, I went into more detail regarding GEICO and Progressive, which is GEICO’s most important competitor. For this overview, suffice it to say that Berkshire shareholders have been spoiled by GEICO’s strong results over a long period of time and recent results have come as a very unpleasant surprise.
Let’s take a look at GEICO’s quarterly results since 2020:
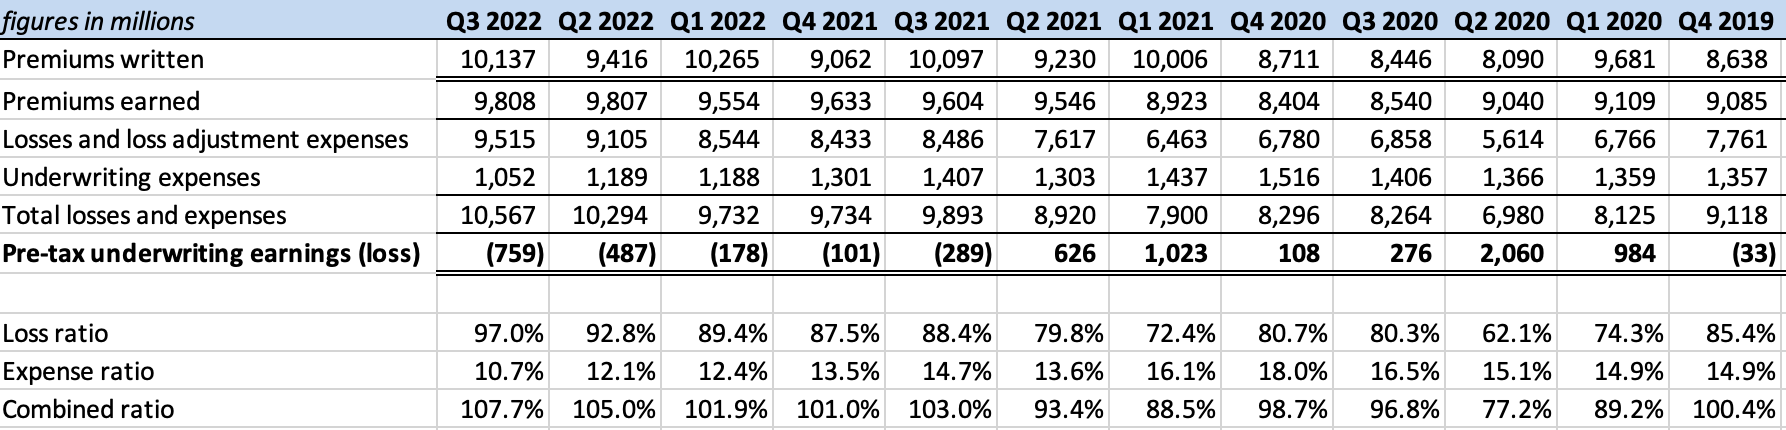
In August, I wrote an article that went into more detail on the reasons behind GEICO’s performance in 2020 and 2021. The thirty second version of that article is that profitability skyrocketed early in the pandemic because lockdowns resulted in fewer miles traveled which means fewer accidents and claims. GEICO implemented a rebate program to return some of the windfall to policyholders. By mid 2021, drivers were back on the road and GEICO was hammered by inflation which turned out not to be “transitory”. Claims severity and frequency increased. GEICO started posting underwriting losses in the third quarter of 2021 and the situation is getting worse.
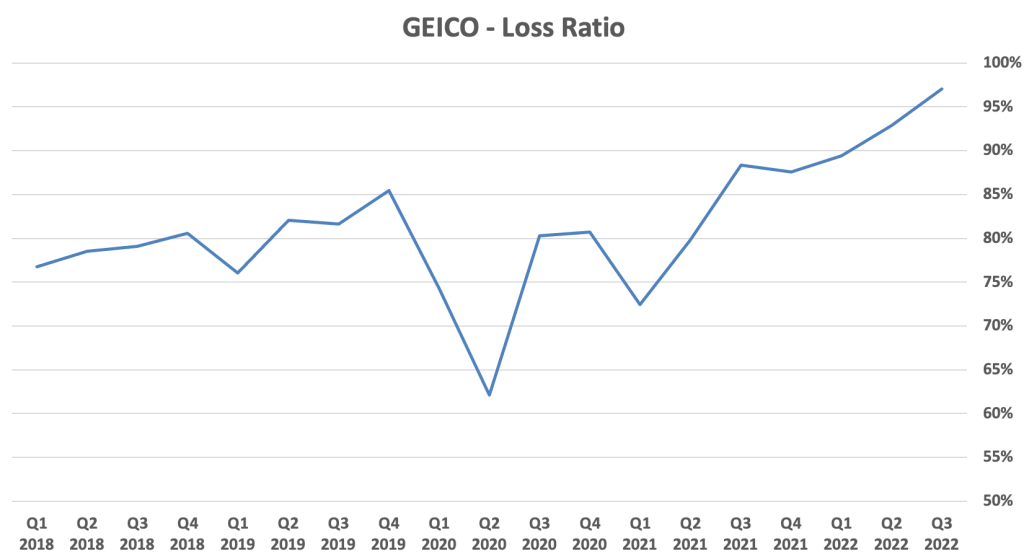
GEICO’s combined ratio is the sum of its loss ratio and expense ratio. As the table shows, the loss ratio skyrocketed from 79.8% in Q2 2021 to 97% in Q3 2022. Meanwhile, cost cutting resulted in the expense ratio falling from 13.6% to 10.7% over the same period. Let’s take a look at the loss and expense ratios in graph form:
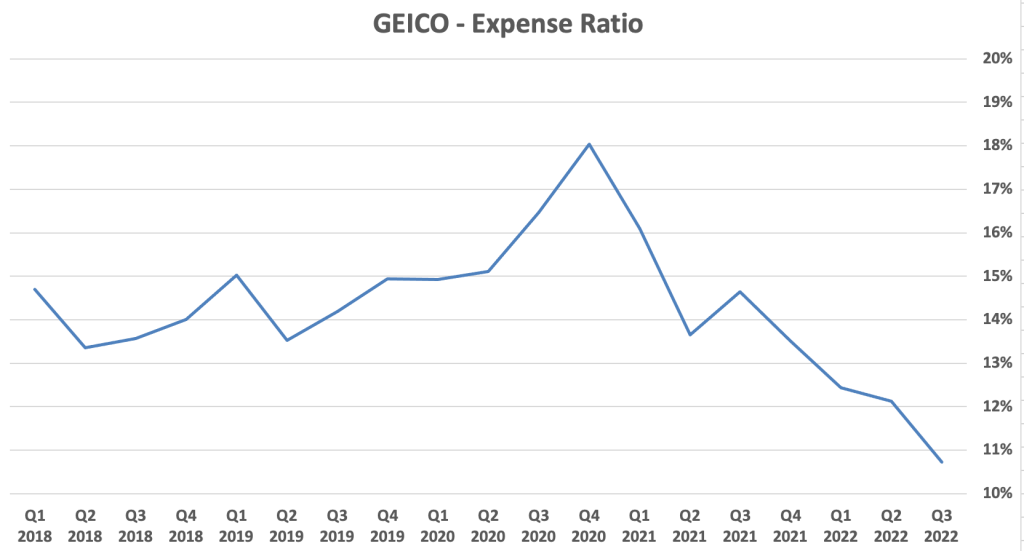
As I wrote last quarter, while the declining expense ratio has softened the blow by reducing GEICO’s underwriting loss, it is not without potential negative effects:
It looks like GEICO’s management has taken steps to control costs and the expense ratio has decreased significantly due to these efforts. While cost-cutting is a natural response during periods of adversity, it is by no means without side effects.
Management has reported that lower advertising costs and lower employee-related costs were responsible for the decline. The automobile insurance industry is highly competitive. GEICO and Progressive have historically been aggressive with advertising in order to build market share. A reduction in advertising expenses could be partly responsible for the decrease in GEICO’s policies-in-force during the quarter.
During the third quarter, the loss ratio rose from 92.8% to 97% and the expense ratio fell from 12.1% to 10.7%. In dollar terms, from the third quarter of 2021 to the third quarter of 2022, GEICO has trimmed expenses by $355 million, or 25.2%. Cost cutting has continued, as management describes in the 10-Q narrative. A number of media sources, such as this recent article, provide more details regarding GEICO’s layoffs and reduction in advertising spending.
While a few quarters of adversity do not necessarily indicate a turning point in GEICO’s long term prospects, recent results compare unfavorably with Progressive. The reason I’ve spent more time on GEICO’s results is because it is clearly the most troubled operation in Berkshire’s insurance group and shareholders will want to watch future developments carefully.1
Insurance – Investment Income
This category includes the income derived from Berkshire’s portfolio of securities. It is important to note that investment income includes dividend and interest but does not include realized or unrealized gains and losses which are excluded from operating income as discussed in the overview section of this article.
Berkshire reported $1,408 million of net investment income in the third quarter of 2022, an increase of 21.3% compared to the third quarter of 2021. For the first nine months of 2022, net investment income was $4,484 million, an increase of 25% compared to the first nine months of 2021.
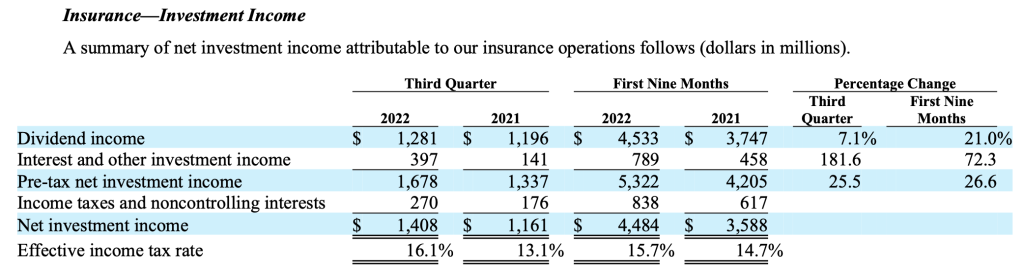
The following chart shows net investment income over the past nineteen quarters. Dividend income varies due to changes in Berkshire’s investment portfolio as well as the timing of dividend payments from investees. Interest income has been positively impacted by the increase in short-term interest rates this year.

It should be noted that the investment income reported in this category pertains only to investments held in Berkshire’s insurance businesses. Berkshire has additional investments held in non-insurance subsidiaries and interest income related to those investments appear in the results of non-insurance subsidiaries. Investments held at the Berkshire parent-company level appear in the “Other Income” category which will be described in more detail later in this article.
The following exhibit shows cash and investments held in Berkshire’s insurance businesses as of September 30, 2022 and December 31, 2021:

Berkshire divides insurance results into underwriting and investment income because management views these activities as distinct from each other. Managers are directed to underwrite with a goal of profitability which provides Berkshire with cost-free float that can be invested alongside equity to generate investment income. Float consists of estimated liabilities that will eventually have to be paid to policyholders but can be invested by Berkshire to generate income until the funds are paid out. As of September 30, 2022, Berkshire had approximately $150 billion of float.
Railroad
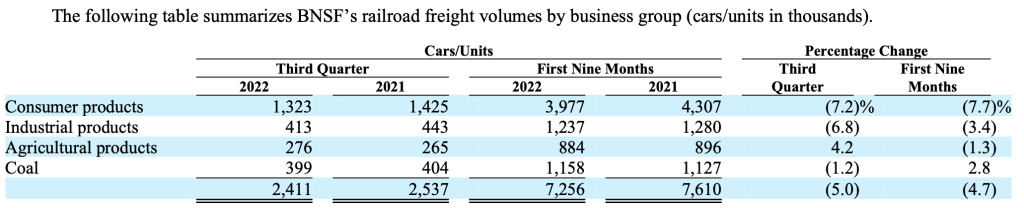
Berkshire acquired BNSF in 2010. In August, I published a profile of BNSF which goes into quite a bit of detail regarding the business model and recent results of the railroad. Historically, BNSF has provided Berkshire, at the parent company level, with significant cash flow to redeploy into other investments.2 The exhibit below shows third quarter and year-to-date results for BNSF:

Although operating revenues increased 16.8% in the third quarter and 14.3% in the first nine months of 2022 compared to 2021, it is important to note that revenue increases were driven by increases in average revenue per car rather than higher volumes. Physical volumes declined, as shown in the exhibit below:
A key metric is the ratio of railroad operating expenses to railroad operating revenues. This measure increased by 8.2 points to 67.7% in the third quarter of 2022 compared to the third quarter of 2021. For the first nine months of 2022, the operating ratio increased 4 points to 65.2% compared to 2021. The profile of BNSF mentioned above provides much more information on the importance of the operating ratio and the factors that drive it.
The exhibit below shows BNSF’s net earnings over the past nineteen quarters:

While BNSF experiences variability in its net income, its results are characterized by much more stability than insurance underwriting. BNSF is required to file a separate 10-Q report with the SEC which goes into more detail than the limited information provided in Berkshire’s financial reporting.
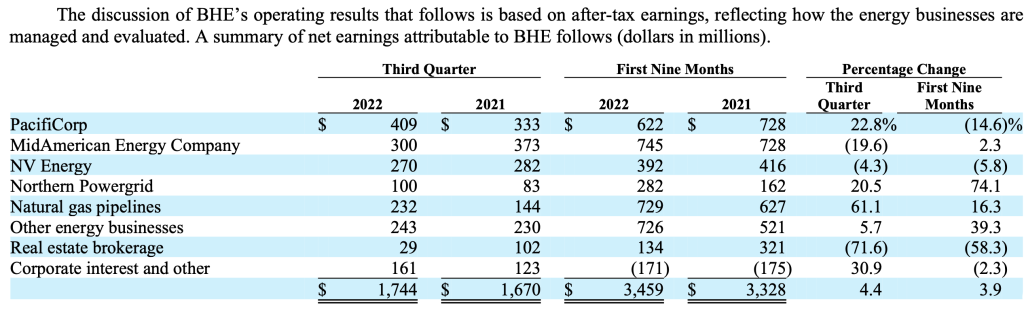
Utilities and Energy
Berkshire Hathaway owns 92% of Berkshire Hathaway Energy (BHE) which includes domestic regulated utilities (PacifiCorp, MidAmerican Energy, and NV Energy), U.K. based electricity distribution businesses (Northern Powergrid), natural gas pipelines, other energy businesses, and a real estate brokerage operation.3 Results for the third quarter and first nine months of 2022 appears in the exhibit below:
The following exhibit shows BHE’s net earnings over the past nineteen quarters. Note that the net earnings figures in the graph below reflect Berkshire’s 92% interest whereas the exhibit above shows total earnings including the 8% minority interest.
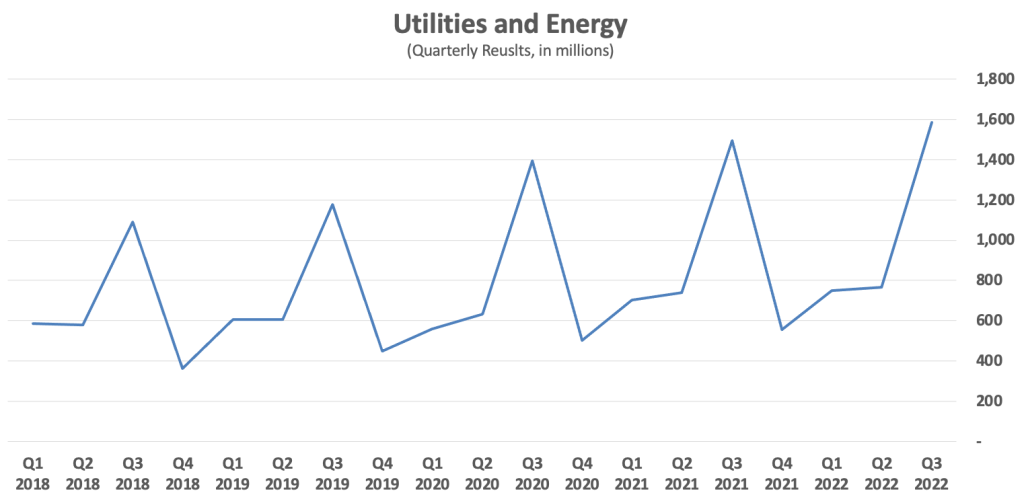
There are notable seasonal trends in BHE’s results, with the third quarter posting the strongest results due to seasonal air conditioning requirements. On an annual basis, BHE provides stable and recurring earnings but Berkshire has chosen to reinvest all earnings within BHE. This is in sharp contrast to BNSF which has up streamed substantial dividends for Warren Buffett to reallocate.
BHE contains a real estate brokerage subsidiary which is very sensitive to changes in the housing market. This is evident in third quarter results which show net income of $29 million compared to $102 million in the third quarter of 2021.
BHE has made substantial investments in renewable energy projects in recent years and posts recurring income tax benefits. BHE’s effective income tax rate was negative 43.1% in the third quarter. BHE is required to file a separate 10-Q report with the SEC which goes into more detail than the information provided in Berkshire’s reporting.
BHE is an interesting business with many moving parts. I am considering writing a business profile on BHE similar to the profile on BNSF published earlier this year. Although it is obviously over a decade old, my 2011 report on Berkshire, In Search of the Buffett Premium, contains historical details on BHE on pages 37-46.
Manufacturing, Service and Retailing
Berkshire Hathaway has numerous non-insurance operating businesses in addition to BNSF and BHE. These are all grouped into the Manufacturing, Service and Retailing group. A summary of revenue and earnings of this group appears in the exhibit below:

I will not attempt to describe each of the businesses within this group, but will present a few exhibits that I think illustrate recent trends at a high level. The exhibit below shows net earnings for the group over the past nineteen quarters:

The pandemic decline and subsequent bounce back is clearly evident in quarterly results, along with growth in net earnings over the past two years. Let’s drill down into results at the reporting segments within this group since the first quarter of 2020. The following exhibit shows revenue and net earnings over this period:

Pre-tax earnings as a percentage of revenue has been on an upward trend in most segments in recent quarters, as we can see in the exhibit below:

A notable exception is that the Consumer Products segment of the Manufacturing Group has experienced notable margin contraction. The same is true for the Retailing group. There are comments in the MD&A that indicate some weakness in consumer spending in the third quarter. In particular, recreational vehicle maker Forest River’s earnings are expected to decline in the fourth quarter of 2022 and into 2023. In the Building Products group, the MD&A notes that higher interest rates are expected to pressure unit sales at Clayton Homes.
Readers are encouraged to review pages 36-41 of the 10-Q which provides a full rundown of all of the significant operations within this large and diverse group of operating companies.
Other Earnings
Berkshire reports other earnings in a catch-all group that includes equity method earnings, accounting acquisition expenses, corporate interest expenses, and the impact of foreign currency exchange rates on Berkshire’s non-U.S. denominated debt. The exhibit below shows after-tax earnings for the third quarter and year-to-date:

Equity method earnings are related to ownership of investments in Kraft-Heinz, Pilot, Berkadia, Electric Transmission of Texas, and Iroquois Gas Transmission Systems. Starting with the fourth quarter of 2022, Berkshire’s equity method earnings will also include Occidental Petroleum since Berkshire’s ownership interest now exceeds 20% of the company. In August, I wrote about how equity method accounting works in general in Berkshire’s Ownership of Occidental Exceeds 20%. Readers interested in learning more about this category of income might find that article interesting.
When Berkshire acquires businesses, it usually records acquisition accounting expenses related to intangible assets. These assets are slowly amortized over a long period of time. Rather than charge each acquired business with this expense, Berkshire records it as a group charge to other earnings. The rationale behind this approach is that amortization of intangibles does not represent the underlying economic performance of subsidiaries and would muddy the waters when it comes to evaluating their performance.
Berkshire’s corporate interest expenses are recorded in this group, but interest associated with other subsidiaries (most significantly at BNSF and BHE) are charged to the results of those subsidiaries directly.
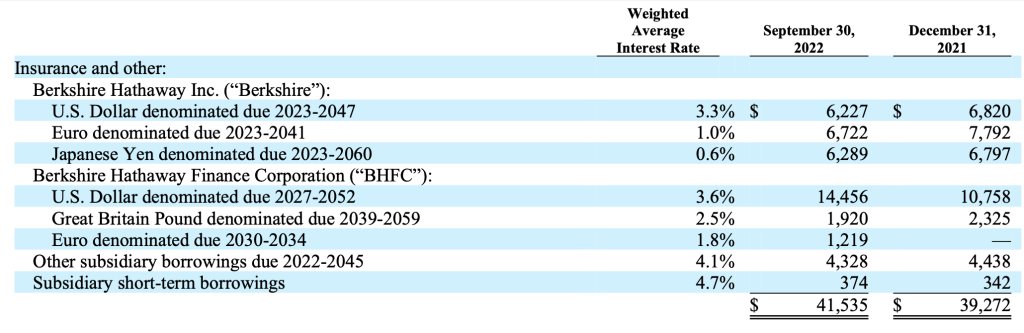
Special attention is warranted when it comes to recent foreign currency exchange rate gains related to non-U.S. Dollar debt. The $2.4 billion of after-tax foreign currency exchange rate gains in 2022 significantly increase reported operating income. These gains are due to weakness in the Euro, Japanese Yen, and British Pound.
The exhibit below shows the notes payable owed in those currencies. As these foreign currencies have weakened, Berkshire recognizes a gain since the amount owed when translated to U.S. Dollars has declined. Such gains could reverse if the U.S. dollar depreciates against these currencies in the future.
Conclusion
Berkshire Hathaway is a very large conglomerate with operations in numerous industries that are reported in multiple segments. In addition, Berkshire owns a large portfolio of marketable securities. This complexity makes it impossible to gain any insights by looking at the company’s consolidated financial statements. When it comes to evaluating operating performance, Berkshire’s Consolidated Statement of Earnings provides very little analytical value. We must look under the hood to gain any meaningful understanding.
The purpose of this article has been to provide readers with a better understanding of the components of Berkshire Hathaway’s net income representing the operating businesses. The overview explains why one must look at net operating income rather than net income in order to strip out the overwhelming effect of changes in the quoted value of Berkshire’s large portfolio of marketable securities. Subsequent sections provide a high-level overview of each category of operating income.
Hopefully this article has helped readers gain a better understanding of operating income at a high level. For those who are interested in learning more about Berkshire Hathaway, I created a resource page on The Rational Walk website with several articles written over the years.
Disclosure: Individuals associated with The Rational Walk LLC own shares of Berkshire Hathaway.
Copyright and Disclaimer
Nothing in this newsletter constitutes investment advice and all content is subject to the copyright and disclaimer policy of The Rational Walk LLC.
Your privacy is taken very seriously. No email addresses or any other subscriber information is ever sold or provided to third parties. If you choose to unsubscribe at any time, you will no longer receive any further communications of any kind.
The Rational Walk is a participant in the Amazon Services LLC Associates Program, an affiliate advertising program designed to provide a means for sites to earn advertising fees by advertising and linking to Amazon.com.
Individuals associated with The Rational Walk own shares of Berkshire Hathaway.
- Todd Combs is the current CEO of GEICO, a role that he has taken on in addition to his investment management responsibilities at Berkshire Hathaway. Combs was the main speaker at the 2022 Graham & Dodd Annual Breakfast and he commented on GEICO. [↩]
- BNSF’s parent is National Indemnity, not the Berkshire Hathaway parent company, but the cash is available to Warren Buffett to reallocate to other investment opportunities. [↩]
- The estate of Walter Scott Jr. owns the remaining 8% of BHE. Berkshire Hathaway Vice Chairman Greg Abel sold his 1% interest in BHE back to the company in June 2022. [↩]