
MRC Global is the largest distributor of pipes, valves, fittings, and related products and services to the energy industry. The company was founded in 1921 as McJunkin Supply Company and grew organically and through acquisitions over the years. In January 2007, Goldman Sachs Capital Partners acquired a controlling interest in McJunkin and in October 2007 merged the company with Red Man Pipe & Supply Company. Over the next four years, several acquisitions were made in a strategy to “roll up” a number of smaller players in the distribution market. In January 2012, the company’s name was changed to MRC Global and Goldman Sachs took the company public in April 2012 at $21 per share. Shares of the company fell dramatically in late 2014 and 2015 due to weakness in oil and gas exploration. Shares have recently been purchased by Fairholme Capital.
Oil Rig Counts
MRC Global’s business prospects are highly correlated with exploration and production activities which, in turn, are very sensitive to the level of commodity prices. Starting in late 2014, the price of crude oil has been very weak and extremely volatile. Crude oil prices below the marginal cost of production in many areas has resulted in rig counts collapsing over the past year. Although MRC Global has international operations, 79 percent of revenue in 2015 was attributable to the United States with an additional 7 percent from Canada. As a result, examining rig counts for the United States and Canada will shed the most light on industry conditions that most directly impact the company’s revenue.
Baker Hughes publishes extensive data on rig counts as a service to the petroleum industry. The website is well worth perusing for anyone interested in the dynamics of the industry. Data are presented in granular formats showing activity by region, well type, and resource plays. For our purposes, it is sufficient to look at North American rig activity at a fairly high level. The exhibit below shows the rig count in the United States over the past sixteen years:

As of April 22, 2016, there were 405 rigs operating on land and 26 rigs operating offshore. This represents a 54 percent decline from the rig count one year ago and a 77 percent decline from two years ago. The current rig count is at the lowest level in the history of the chart and far below the average level of slightly over 1400 rigs. During the oil price collapse concurrent with the financial crisis, the oil rig count bottomed at 876 rigs in early June 2009, a level that is more than double of today’s rig count! To say that the industry is in a severe depression could be an understatement.
The situation in Canada is also extremely depressed as we can see from the exhibit below.

The chart shows much more volatility due to seasonal factors in Canada that limit the level of drilling activity during the annual spring thaw. However, it is obvious that the level of peak activity in 2015 was far below the peak level of any of the prior years in the chart. Only 40 rigs were active in Canada on April 22, 2016, which is roughly half of the rig count one year ago.
Although the price of crude oil has recovered significantly since the lows of the first quarter, rig counts have not yet responded to higher prices perhaps because the current price of oil is still below the marginal cost of production for many E&P companies. Additionally, many debt heavy E&P players are in severe financial distress and might not be in a position to quickly resume production unless prices rise significantly from current levels.
In contrast to the depressed state of the North American industry, the level of activity in international markets has not fallen as precipitously. Baker Hughes publishes global rig count data. Activity in certain locations with a low marginal cost of production, such as the Middle East, has shown no meaningful reduction. However, with only 14 percent of MRC Global’s revenue coming from outside the United States and Canada, stability in international markets will not be a major factor in the company’s success in the near term. MRC Global’s revenue will be highly sensitive to the future trends in the charts shown above.
Operating Performance
MRC Global had total revenue of $4.5 billion in 2015 which represents a 24 percent decline from 2014. Revenue declined in all three of the company’s segments which are organized by region. Canada was particularly hard hit with a revenue decline of 47 percent. The exhibit below shows the company’s revenue broken down by geographic reporting segment:

The decline in revenue was also evident in all product lines sold by the company but particularly notable in the oil country tubular goods category. This business is directly tied to drilling activity in the United States and is characterized by high volatility and extremely low margins. MRC Global disposed of the tubular goods business in February 2016 and posted a loss associated with the disposal in 2015 financial results. The exhibit below shows the breakdown of revenue by category in 2015.

In general, the distribution industry is characterized by relatively low operating margins. MRC Global has historically realized its best operating margins in the United States segment with more modest performance from Canadian and International operations. During times of healthy drilling activity, such as 2012 through most of 2014, it appears that the company can generate operating margins in the 5 to 7 percent range. In 2015, significant goodwill write-downs in the United States and International segments resulted in an operating loss. Excluding goodwill impairments, the operating margin would have been 4 percent for 2015. The exhibit below provides a summary of operating results since 2010:

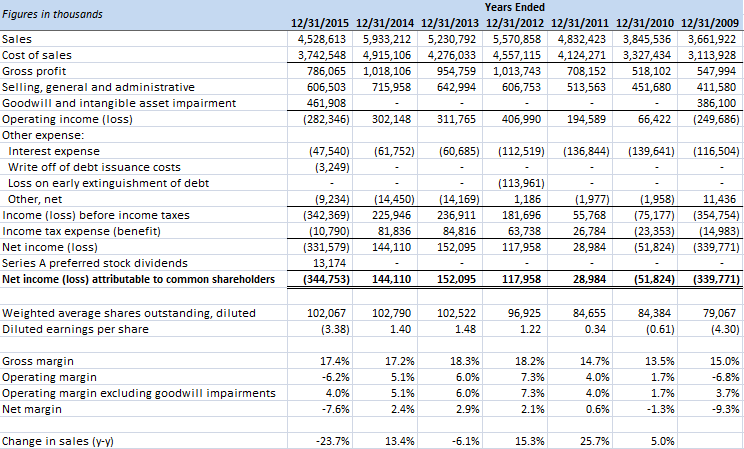
Gross margins have generally been in a range of 17 to 18 percent in recent years and management has indicated that gross margin in the high 17 to low 18 percent range is likely for 2016 as well. The company’s income statements for the past seven years appear in the exhibit below.
Free Cash Flow and Capital Allocation
One of the interesting characteristics of the distribution industry is that working capital requirements decline along with drilling activity which generates operating cash flow in years like 2015. Both inventory and accounts receivable decline when business slows which makes cash available and provides some degree of operational flexibility. The business has low capital requirements other than the maintenance of enough inventory to satisfy the demands of customers. As a result, traditional capital expenditures are relatively minor.
As we can see from the income statements above, MRC Global posted a net loss of $345 million in 2015. However, free cash flow was a positive $651 million. The goodwill and intangible impairment of $462 million was a non-cash charge that turned what would have been an operating profit into an operating loss. Additionally, both inventory and accounts receivable balances declined, partially offset by a decline in accounts payable. Operating cash flow was $690 million and capital expenditures were $39 million.
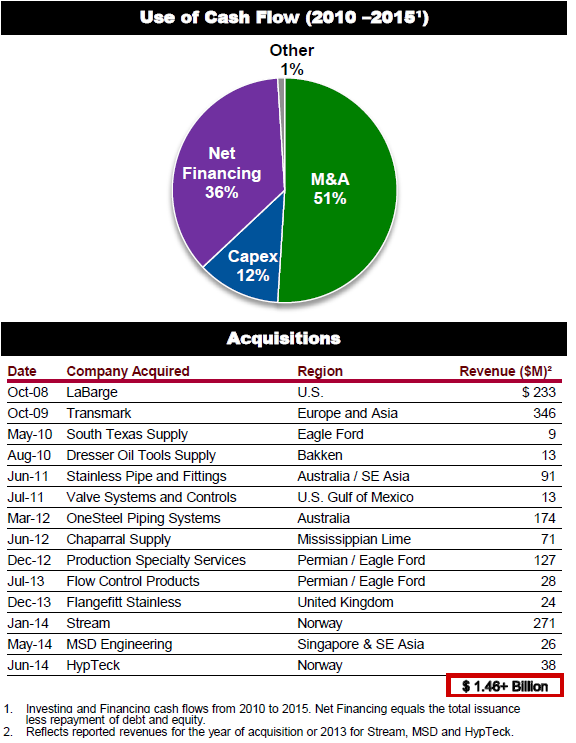
Over the past five years, the company posted cumulative free cash flow of $919 million, well in excess of reported net income of $112 million. A significant portion of free cash flow was used to fund acquisitions using $583 million over past five years. It should be noted that the large goodwill impairments in 2009 and 2015 could be signs that management has overpaid for acquisitions in the past. On the other hand, both impairments were taken in years when the price of oil declined to low levels and resulted in low rig counts. Accounting rules require such write-downs even if long term prospects might be more favorable and goodwill that is written down can never be “written up” in future years. Ultimately, management’s track record with respect to acquisitions will be measured based on free cash flow generation.
The exhibit below is taken from MRC Global’s investor presentation (pdf) at the BB&T Capital Markets 10th Annual Commercial & Industrial Conference on March 24, 2016 and illustrates the company’s use of cash flow over the past six years along with acquisitions since October 2008.
Capital Structure
MRC Global’s capital structure is currently less leveraged than it has been historically. Management used the strong free cash flow in 2015 to pay down significant debt. Additionally, convertible preferred stock was issued in June 2015. Net debt was reduced by $974 million in 2015, a reduction of 68 percent. Currently the only long term debt is a $524 million loan due in 2019.
Although balance sheet risk has been reduced over the past year, the terms of the preferred stock offering may not be favorable to owners of the common stock in the long run. The 6.5% cumulative preferred is convertible into common stock at $17.88 per share. While this is above today’s quote, it is likely that the preferred stock will eventually convert to common stock once rig counts increase and business prospects improve. As a result, it is probably a good idea to simply assume dilution when analyzing the company. The share count can be expected to increase by 20.3 million if the preferred stock is converted in full. With shares outstanding of 102 million as of December 31, 2015, conversion would represent slightly under 20 percent dilution.
We would note that the working capital reductions that made strong operating cash flow possible in 2015 despite the industry downturn will certainly reverse once business conditions improve. MRC Global will need to direct significant capital toward inventory and an increase in accounts receivable. It appears that the company should have the financial flexibility to increase working capital once business conditions begin to improve although this might require adding leverage to the balance sheet.
Book value per share was $9.35 at the end of 2015 but tangible book value was close to zero so shareholders cannot rely on any tangible downside protection from a balance sheet perspective. Shares recently traded at around $14 at a market capitalization of approximately $1.4 billion.
Conclusion
As the largest distributor of critical components and services to the oil and gas industry, MRC Global plays a very important role in the energy economy. The business is highly correlated to drilling activity as represented by rig counts. The collapse in energy prices caused rig counts to decline precipitously in 2015 (continuing into early 2016) and this had a major impact on MRC Global’s financial results. However, management used strong free cash flow primarily generated through working capital reductions to deleverage the balance sheet. A preferred stock offering, although potentially dilutive, further reduced the company’s risk profile.
MRC Global is not a wonderful business but it is an important business in a very important industry. If rig counts remain depressed throughout 2016, MRC Global’s financial results will remain depressed as well and it is possible that further write-downs of intangible assets will be required. Market sentiment would be negative under such conditions and the stock price is also likely to be correlated to the price of oil. Eventually, supply and demand dynamics should result in a more normalized level of production in the United States and Canada. The key question is when this “eventual” outcome will materialize.
As long as MRC Global does not face financial distress before a recovery commences, the share price should eventually recover along with industry activity. The main risk appears to be a prolonged downturn with rig counts remaining at very low levels. Investors who believe than energy prices will recover over the next couple of years might want to consider MRC Global, or other large distributors such as Now Inc., rather than investing in oil directly or through E&P companies.
Disclosure: No position in MRC Global.